Happy 1st Days of Autumn Dear Clients and Friends,
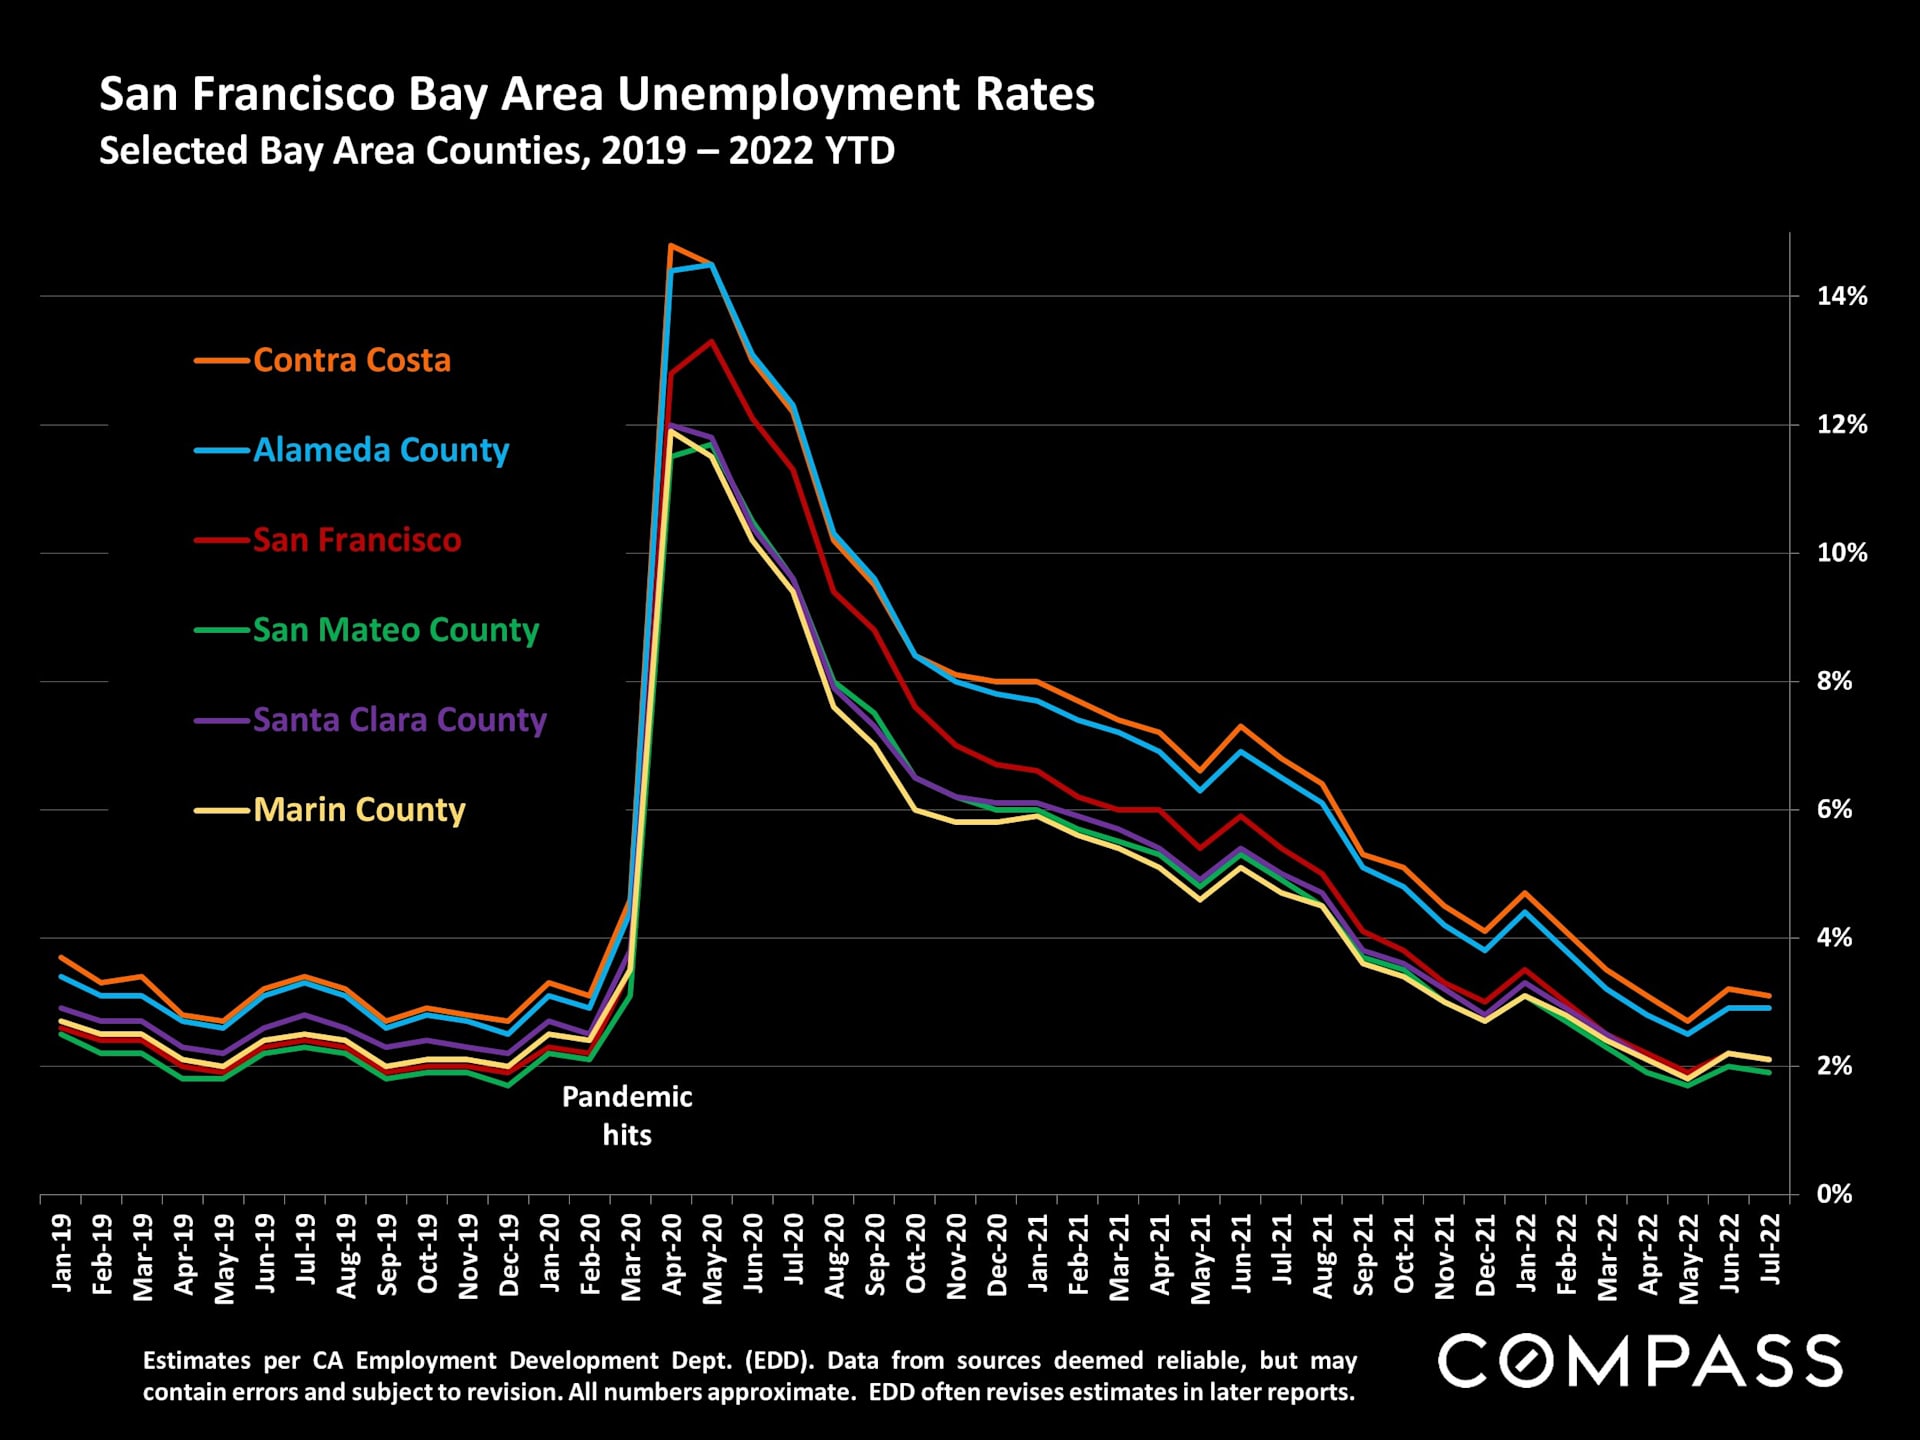
While the economic headlines paint a very tough picture nationally, and we are not immune, our current real estate market performance in Marin suggests we will likely perform better than almost all areas of the US.
This month we are presenting a different compilation of data from several sources. We are focusing on the back story of the why's versus just sales stats.
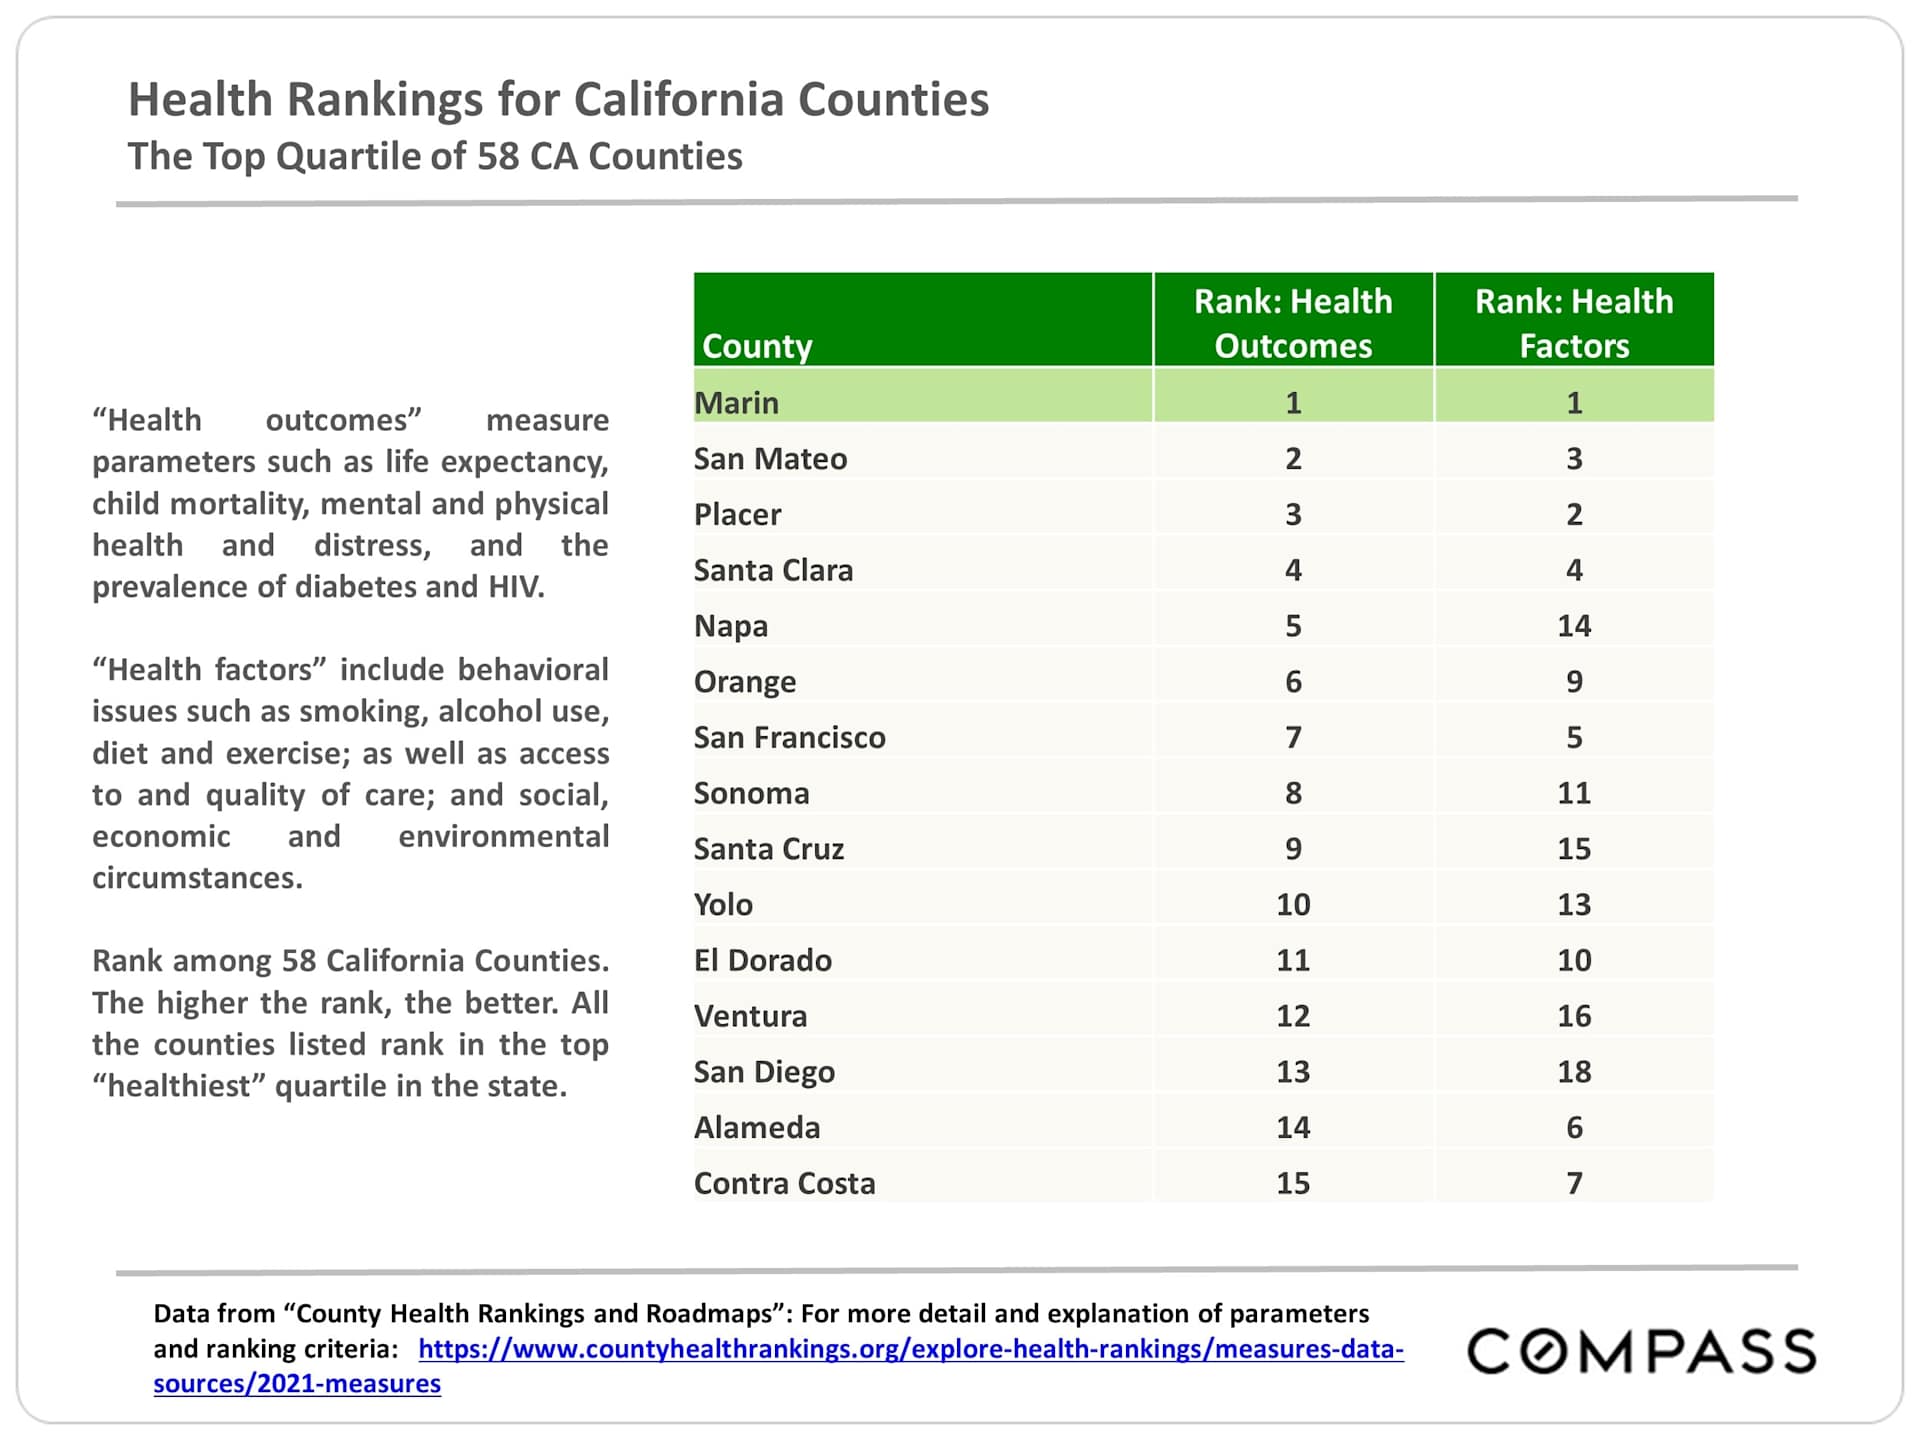
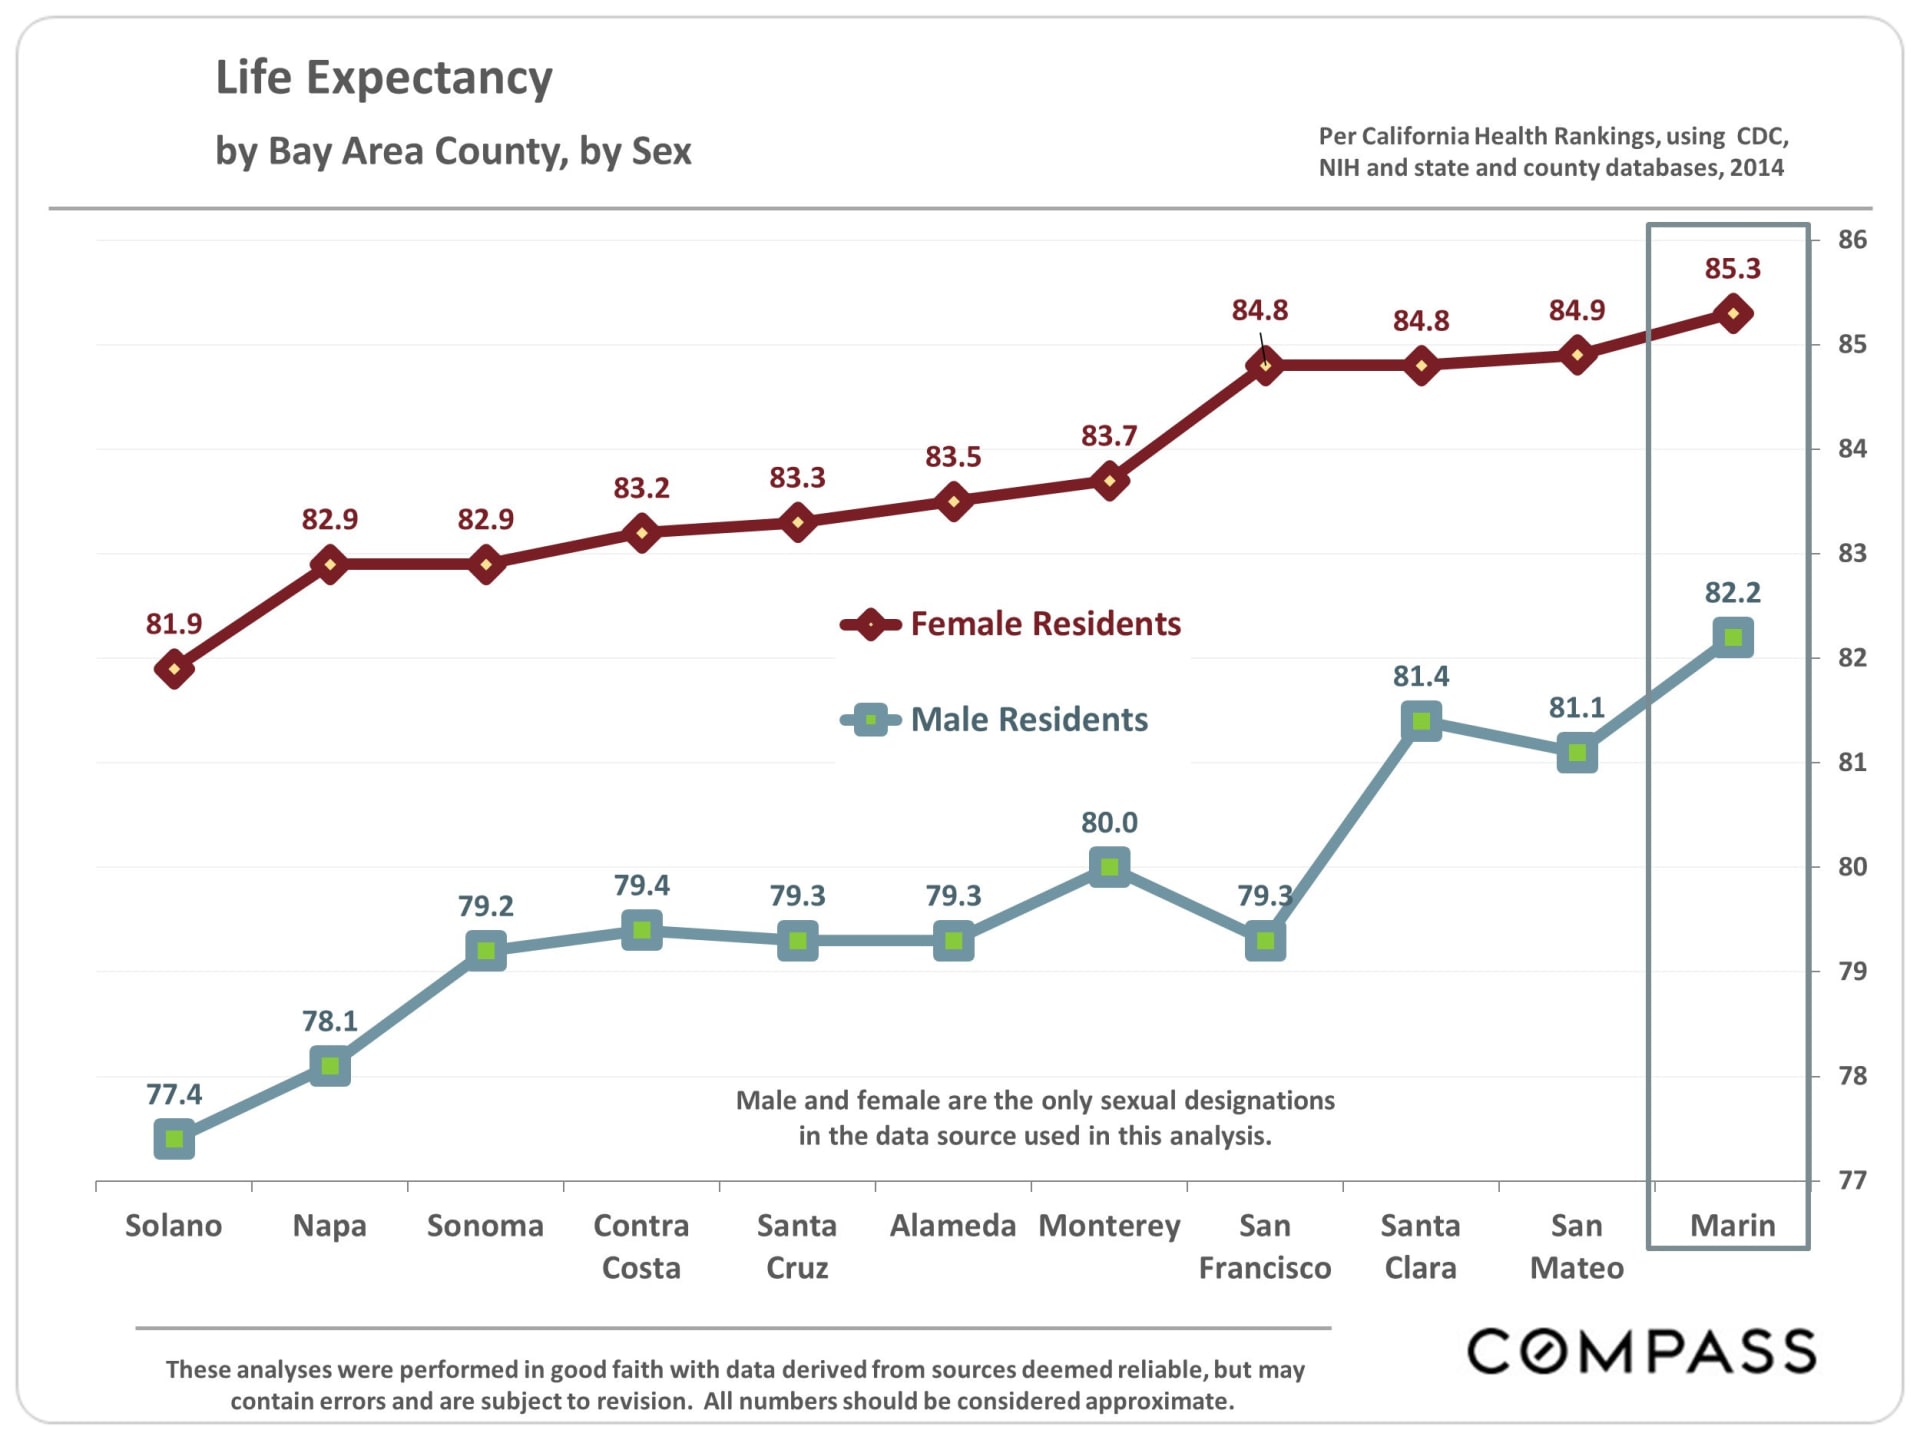
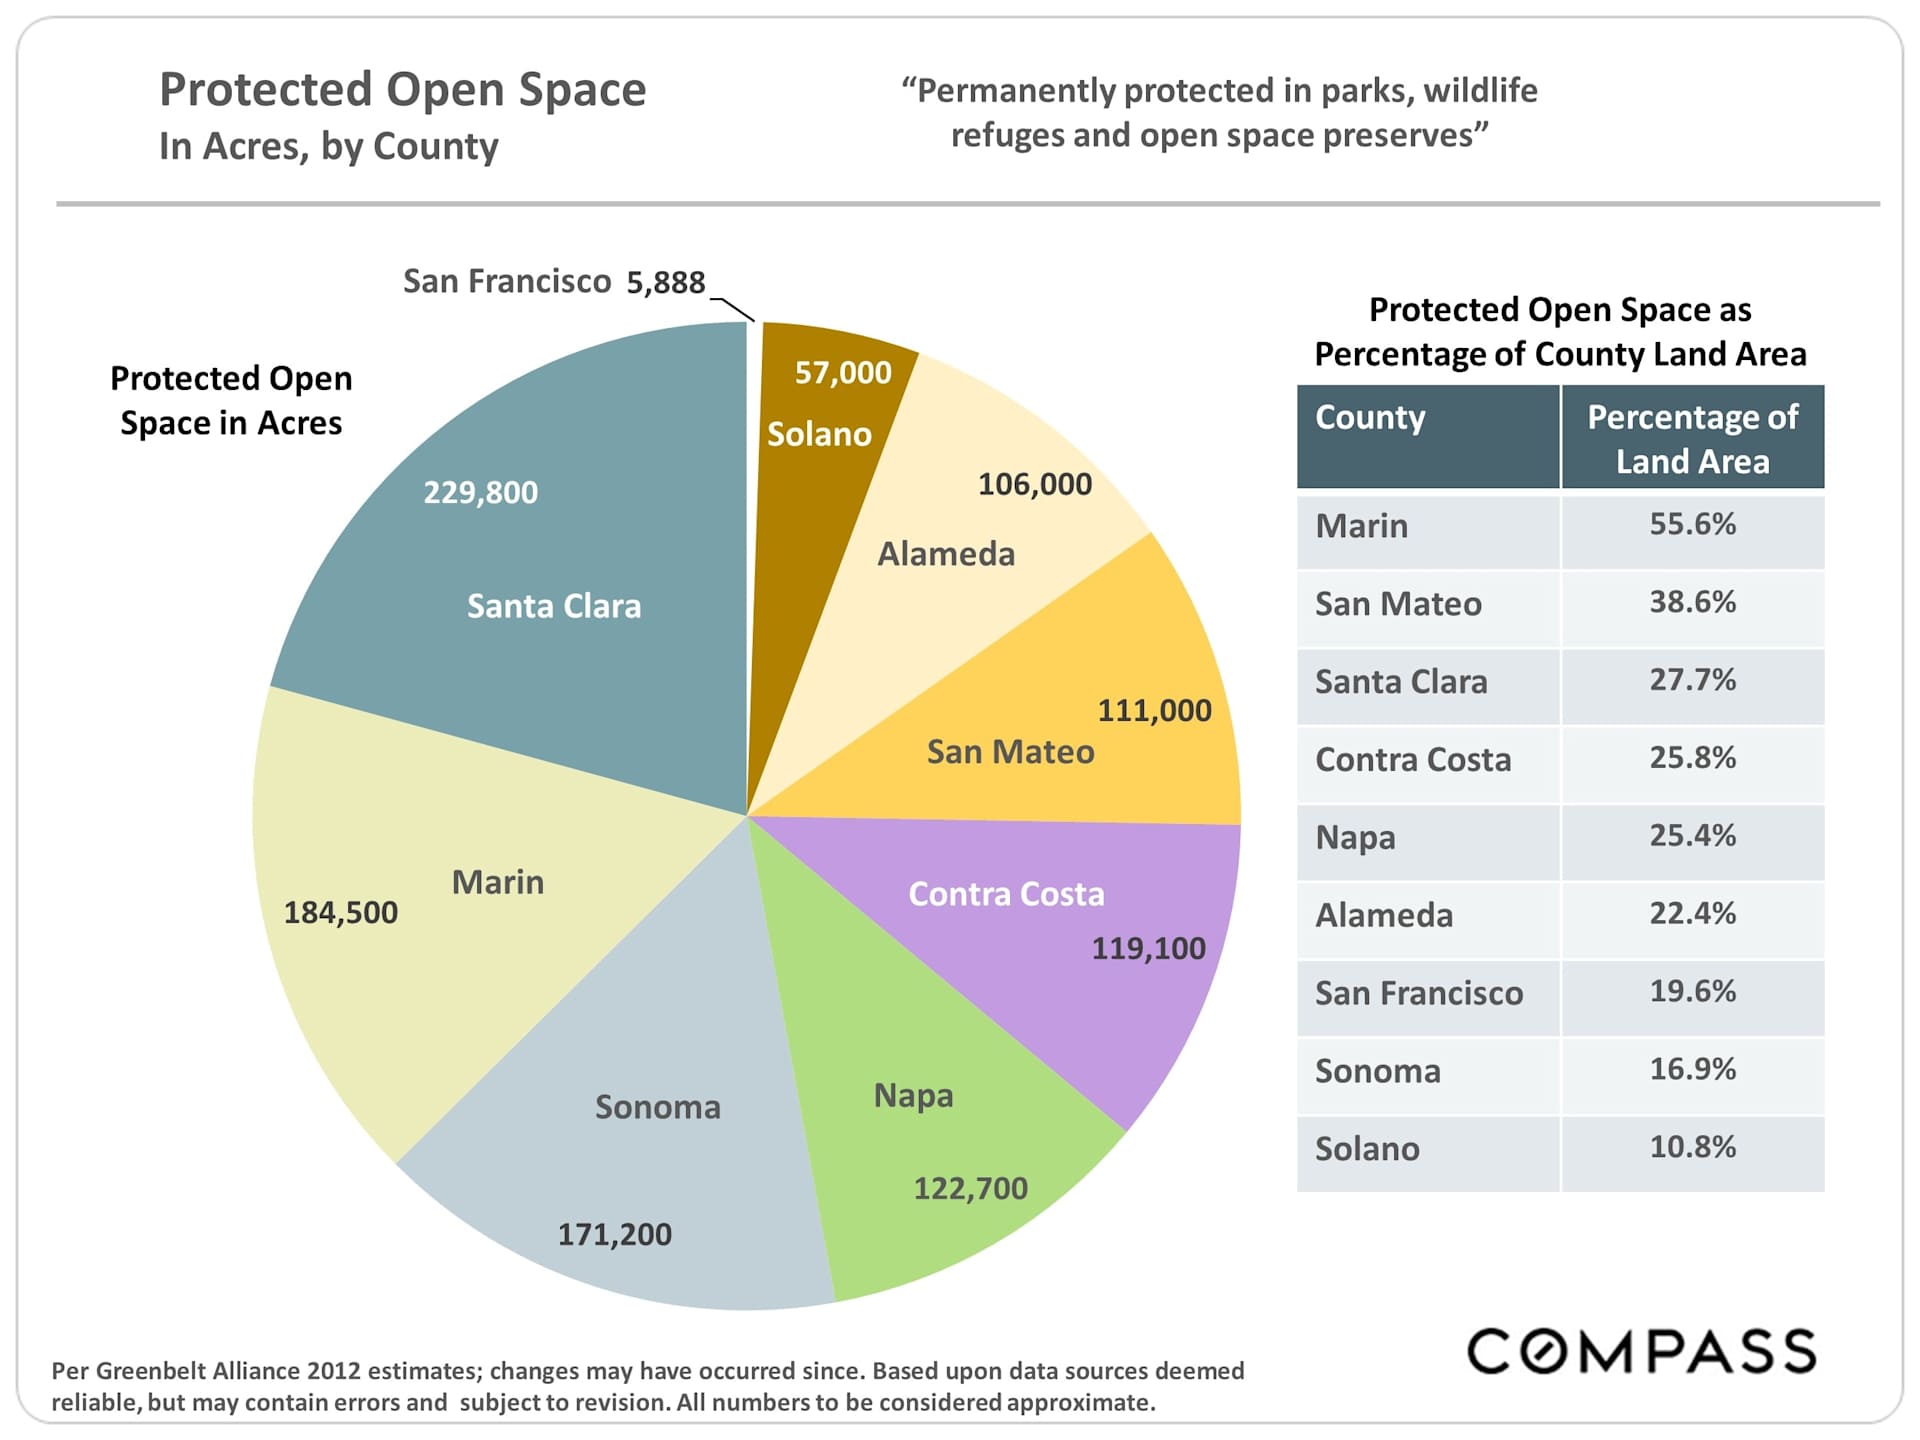
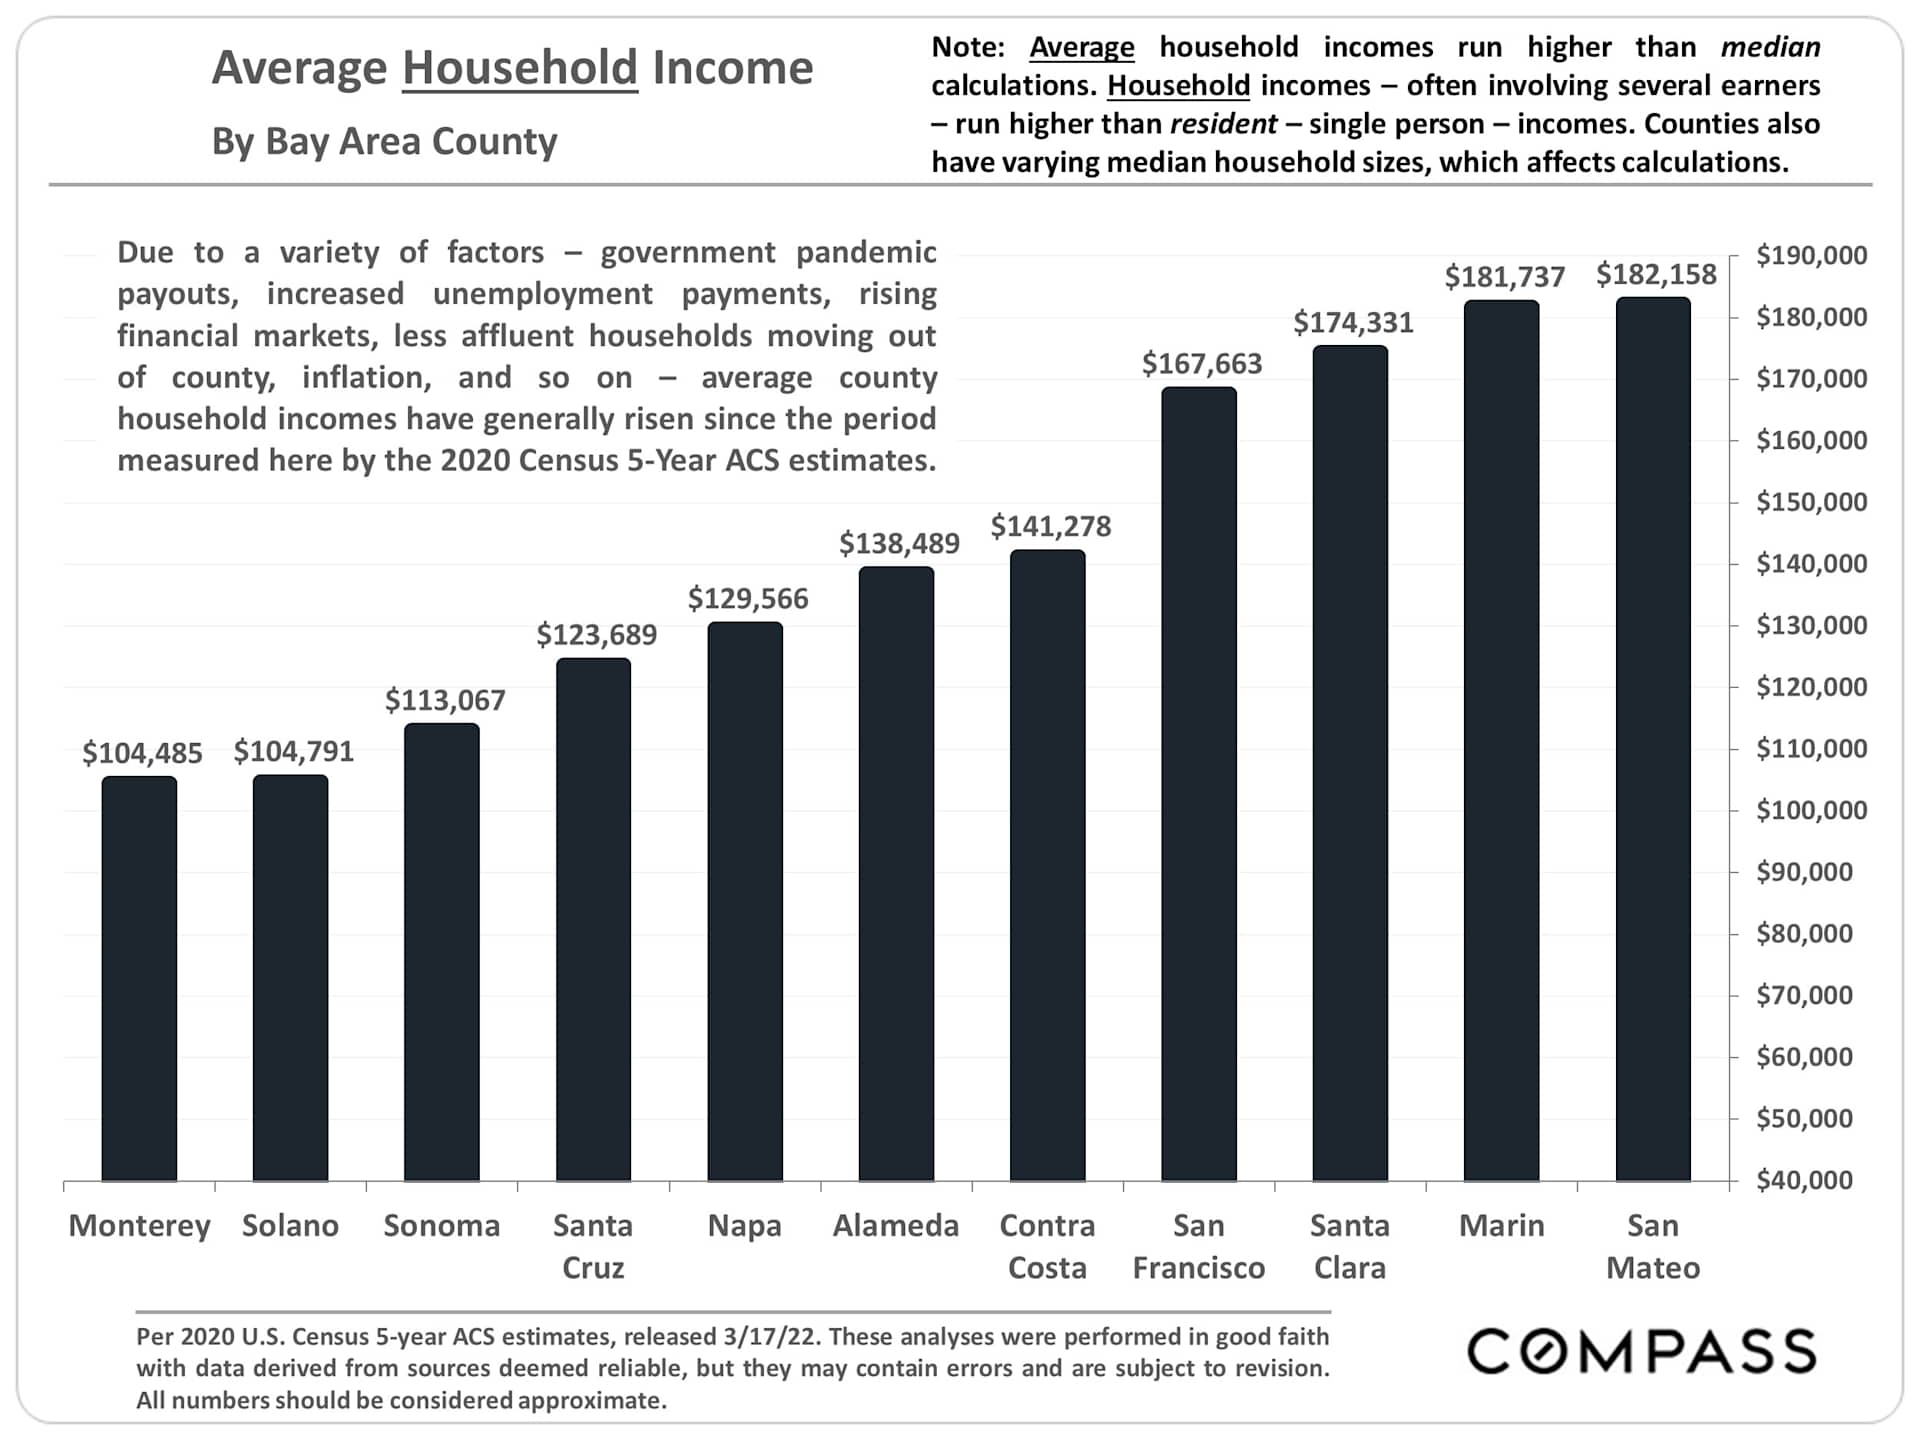
The demographics of our county offer key insight. Did you know we are the healthiest and longest living county in the entire state? Wow! And we are one of the wealthiest in the nation.
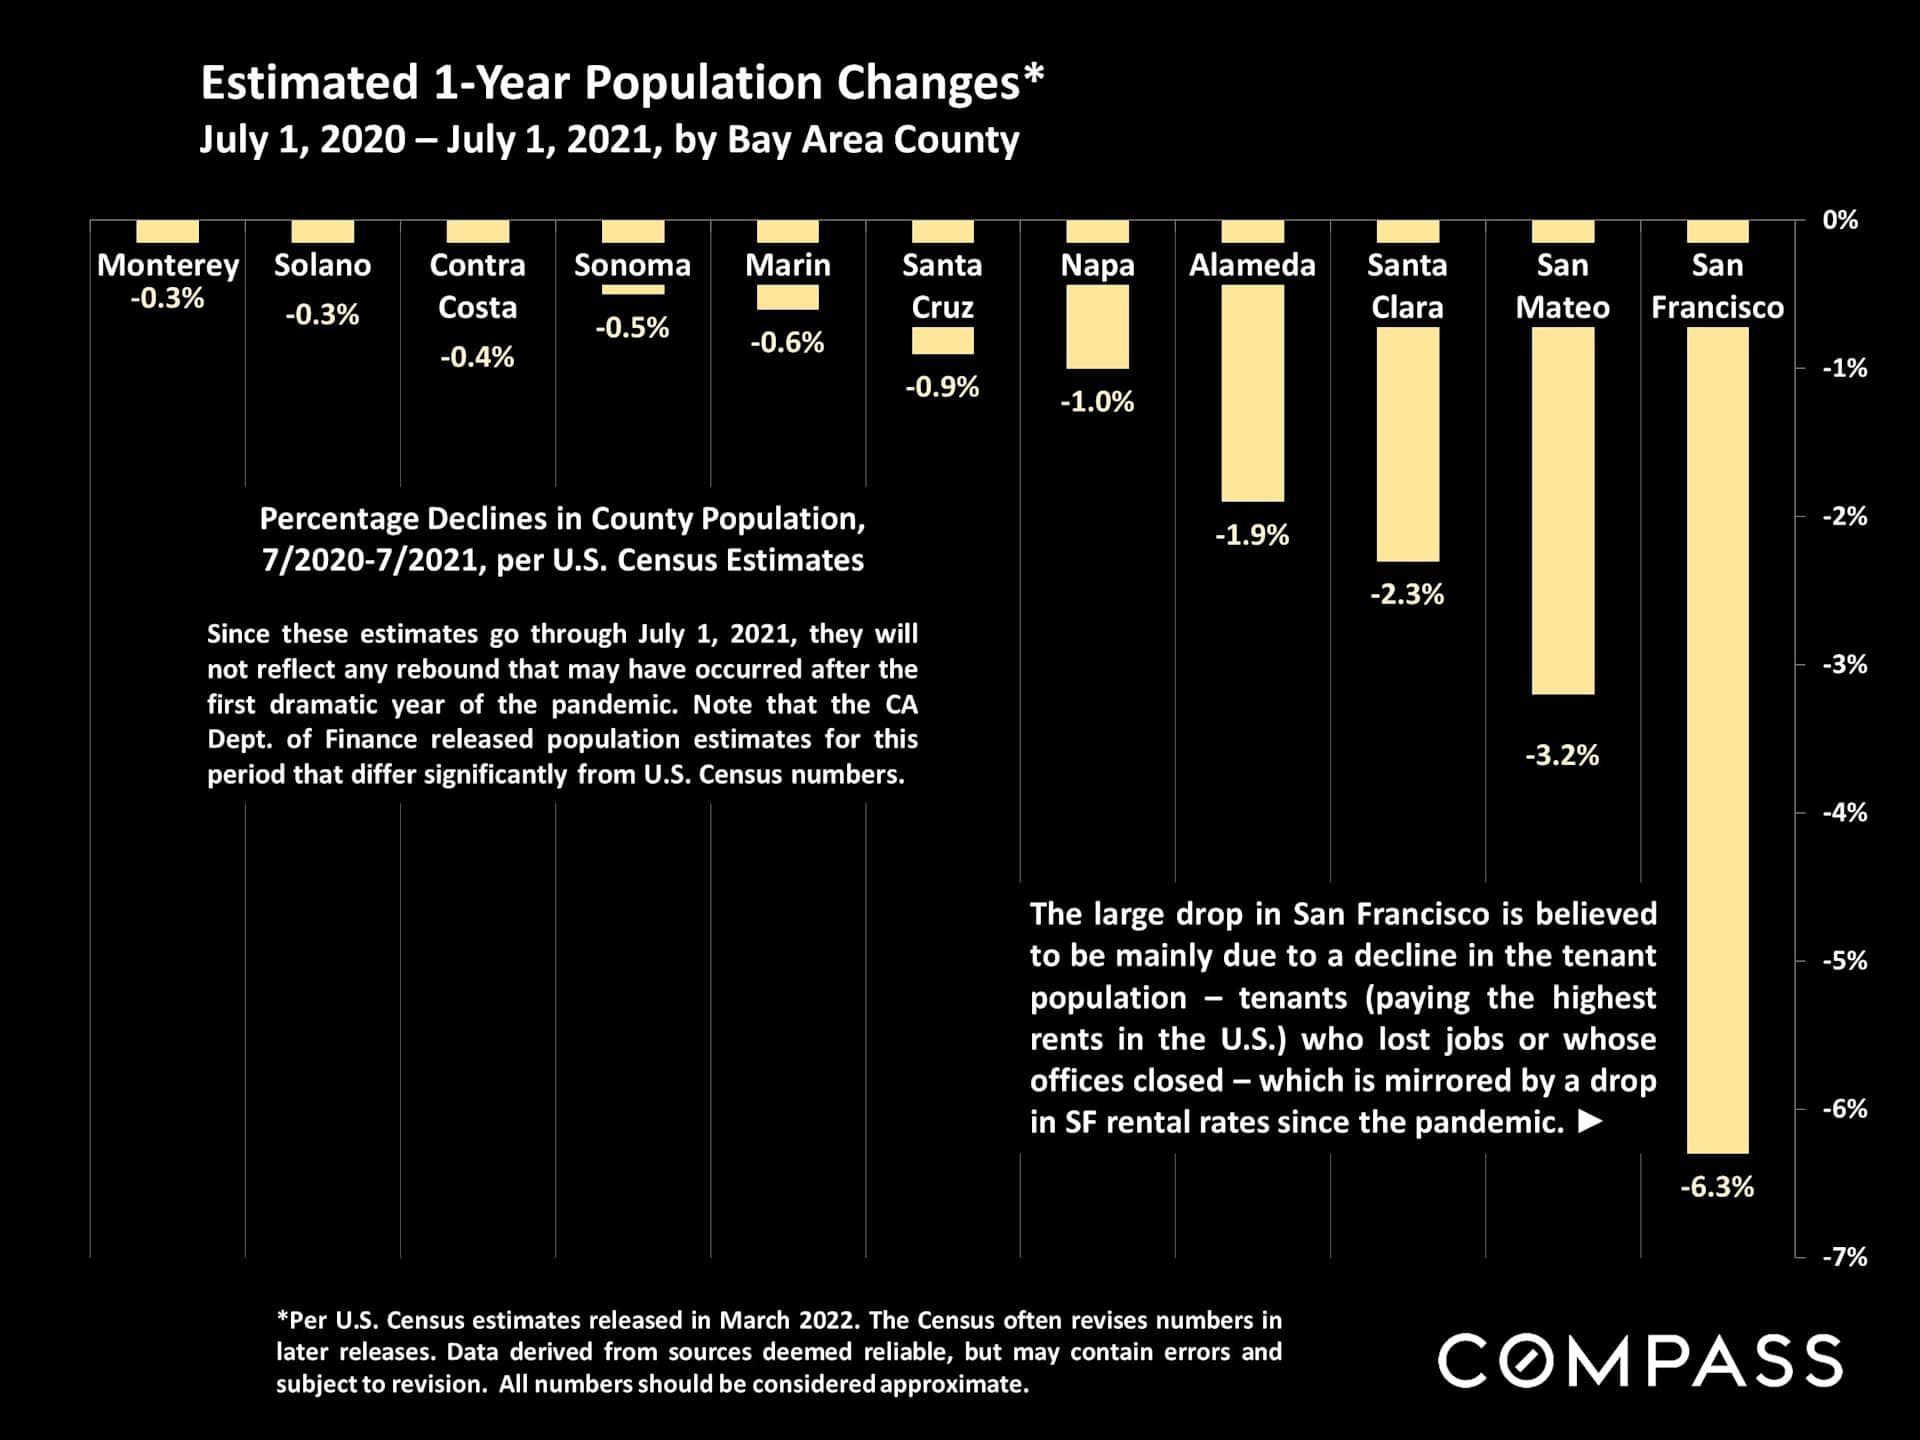
See the exodus numbers from San Francisco since 2020. While there has been much media shouting out of state migration, Marin's uptick benefitted greatly since the pandemic began and will continue to benefit from headquarters of many significant major employers remaining between Silicon Valley and San Francisco. Executive leadership remains here and they need somewhere to live comfortably with their families. It's also cheaper to live in Marin than on the Peninsula or Pacific Heights....and the statistics below suggest with a higher quality of life.
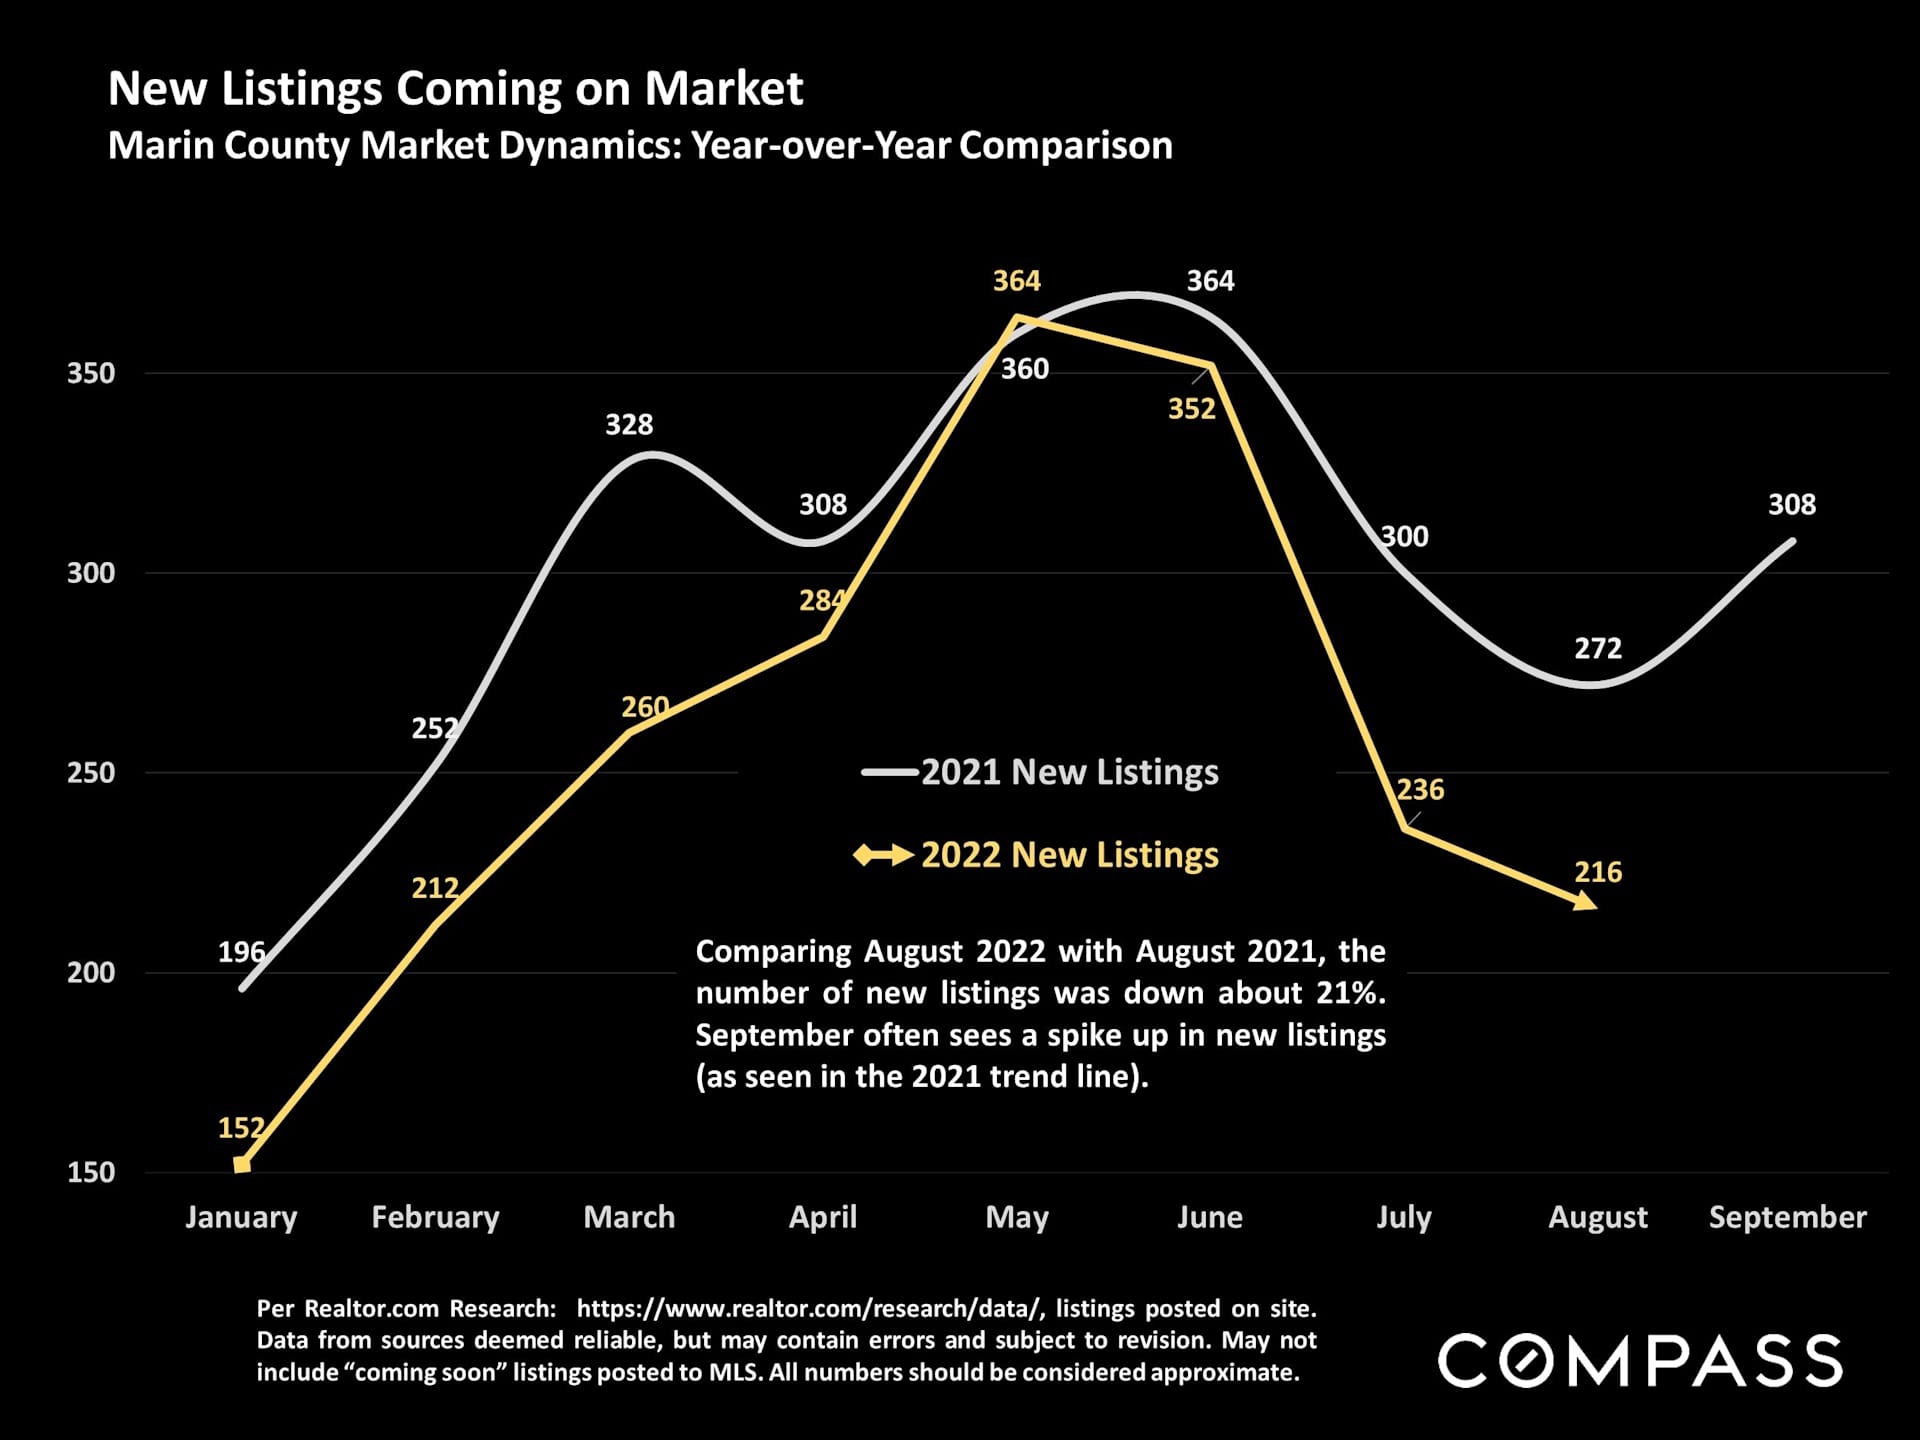
Of course we are not immune to a significant slowdown in both the numbers of new listings and sales since April, when the effects of the Fed actions truly began impacting our market.
Here are some key takeaways telling the net story (chart stats below):
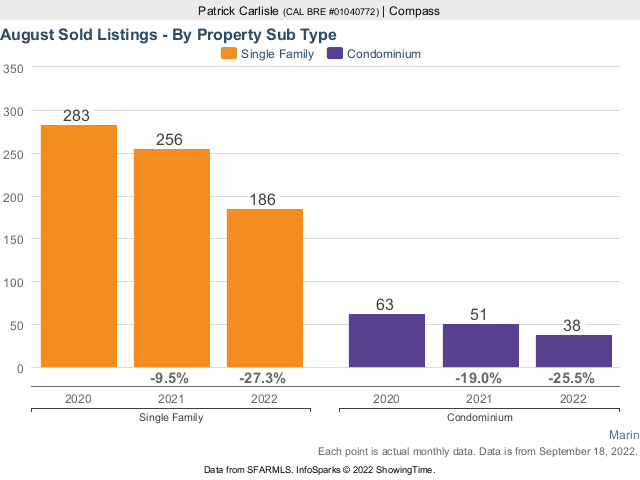
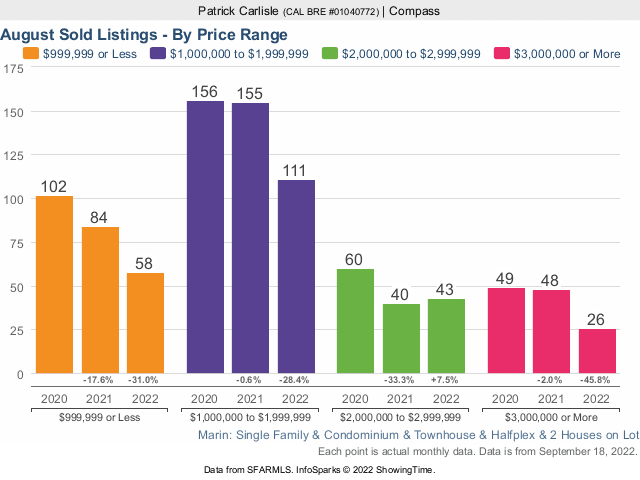
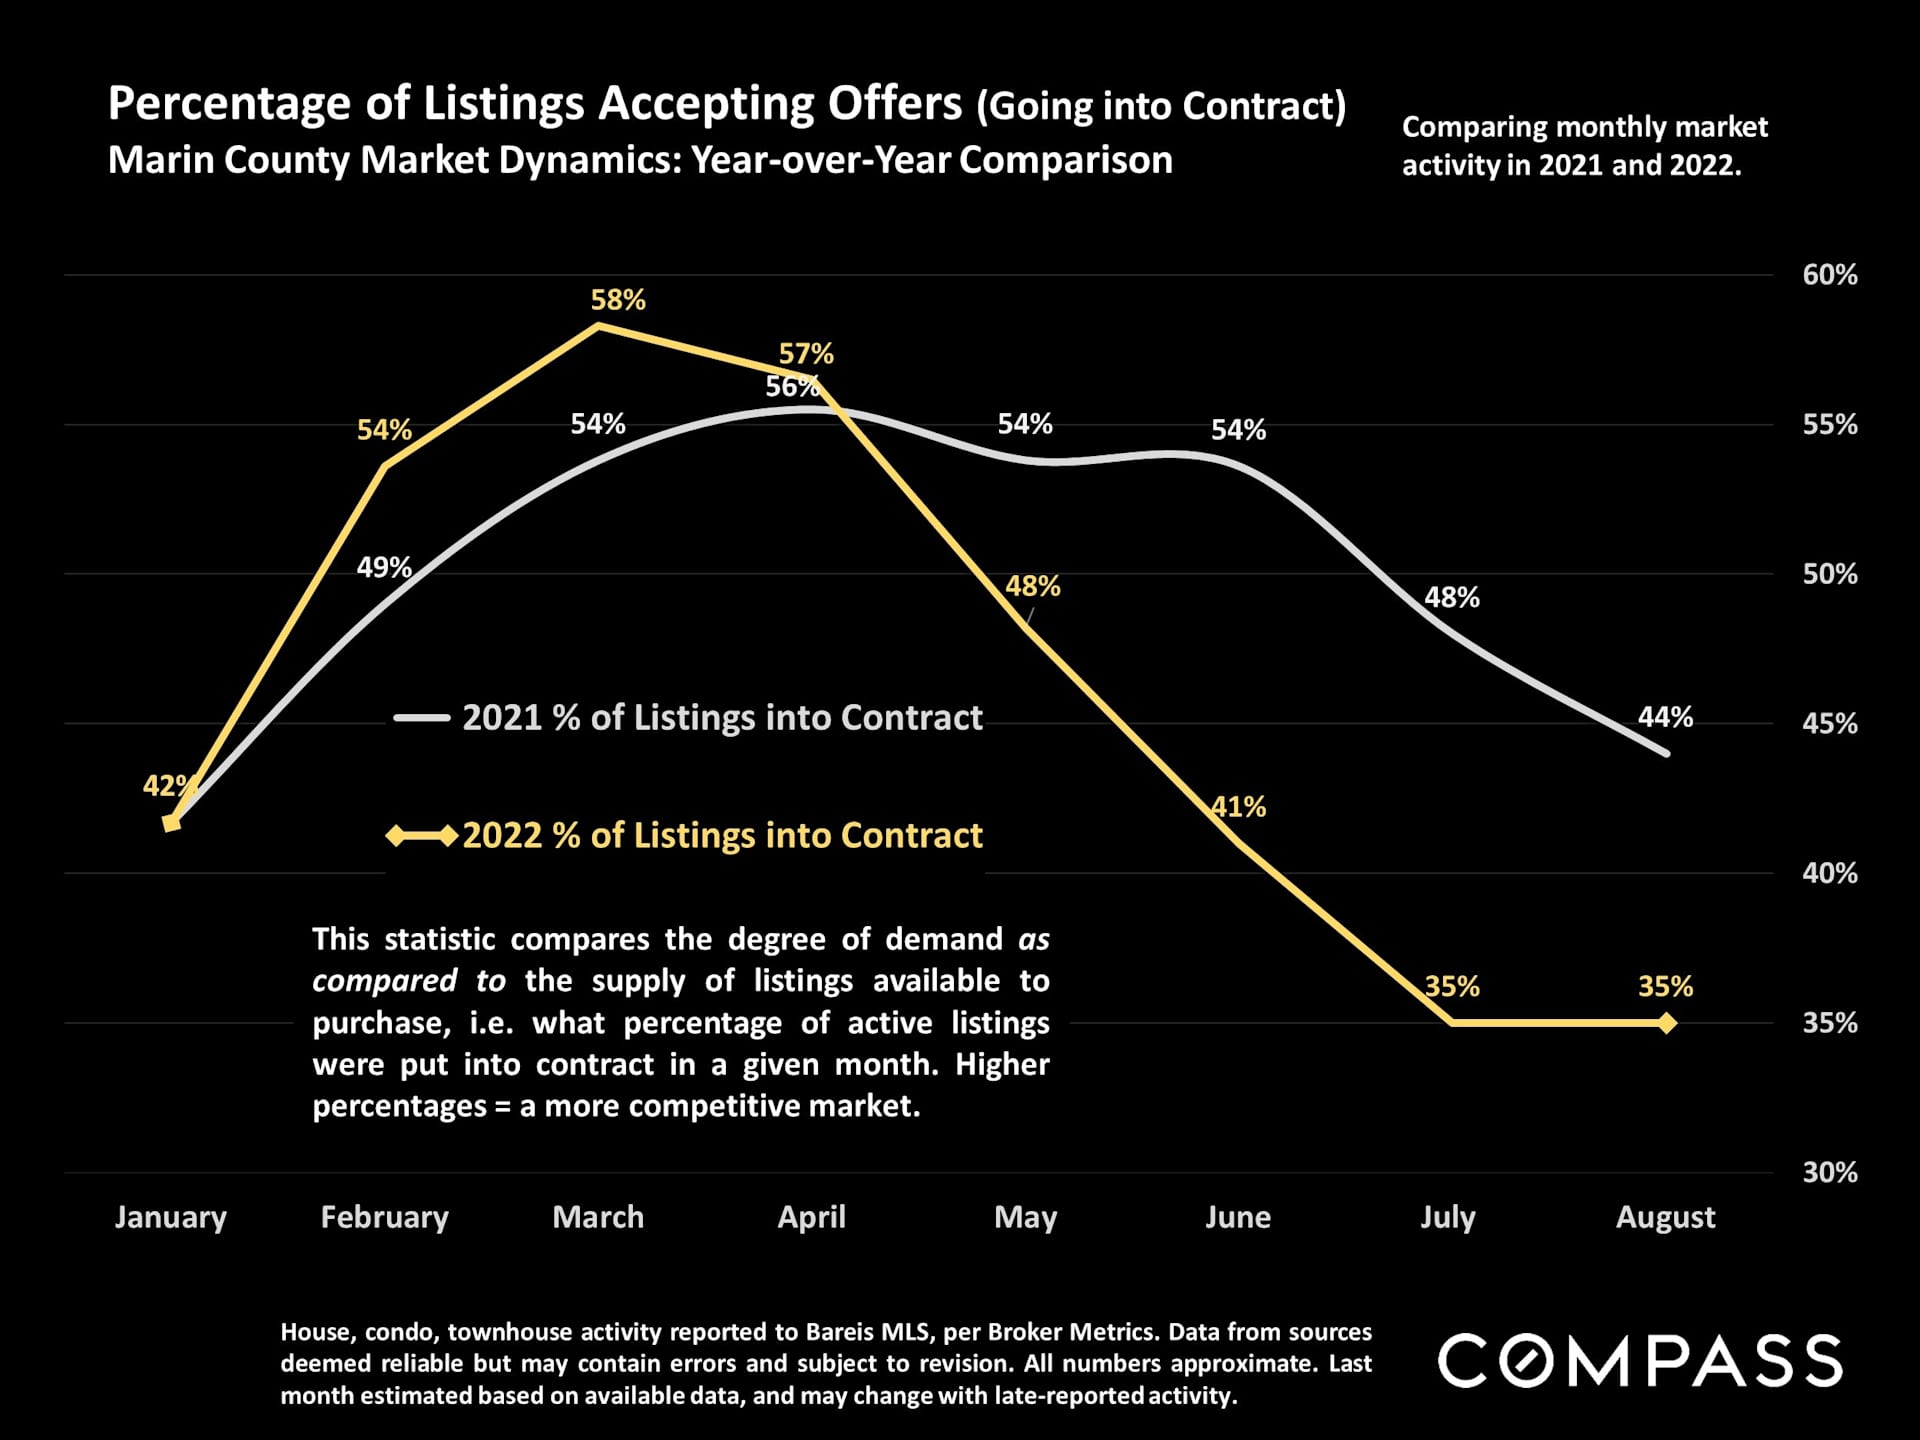
- The number of homes closing escrow in all Marin in August was down 27% year over year (25.5% for condos). We had 25% fewer going into contract. FYI, traditionally August is a vacation month and typically produces fewer sales, but the August 2022 drop is significant.
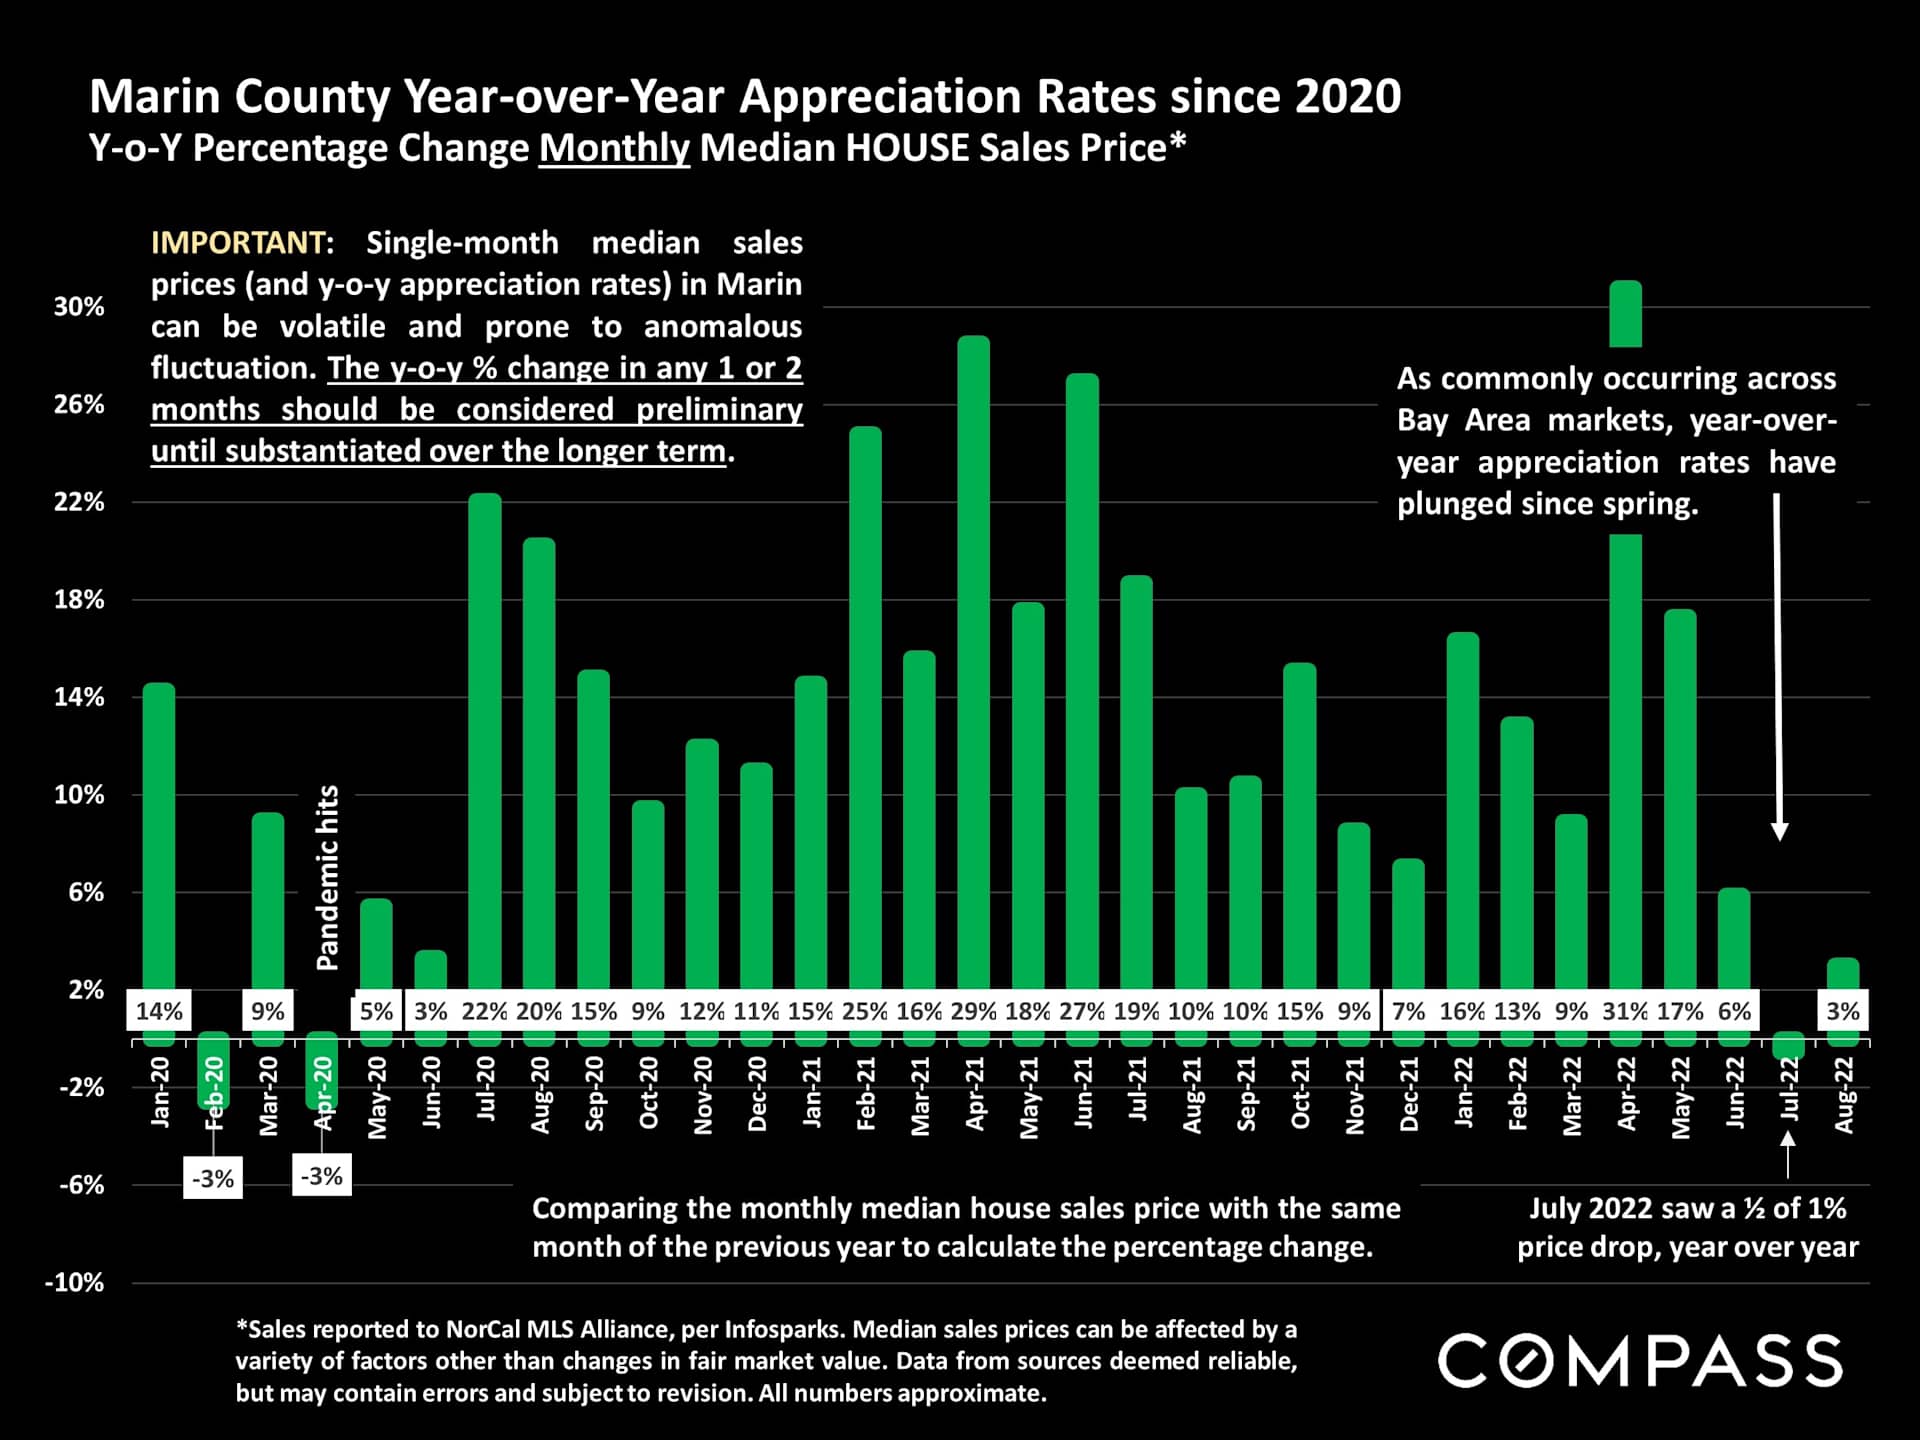
- Average Marin value appreciation rate in August is still up 3% year over year. The Bay Area overall is at -2% appreciation, although varies greatly by county and community.
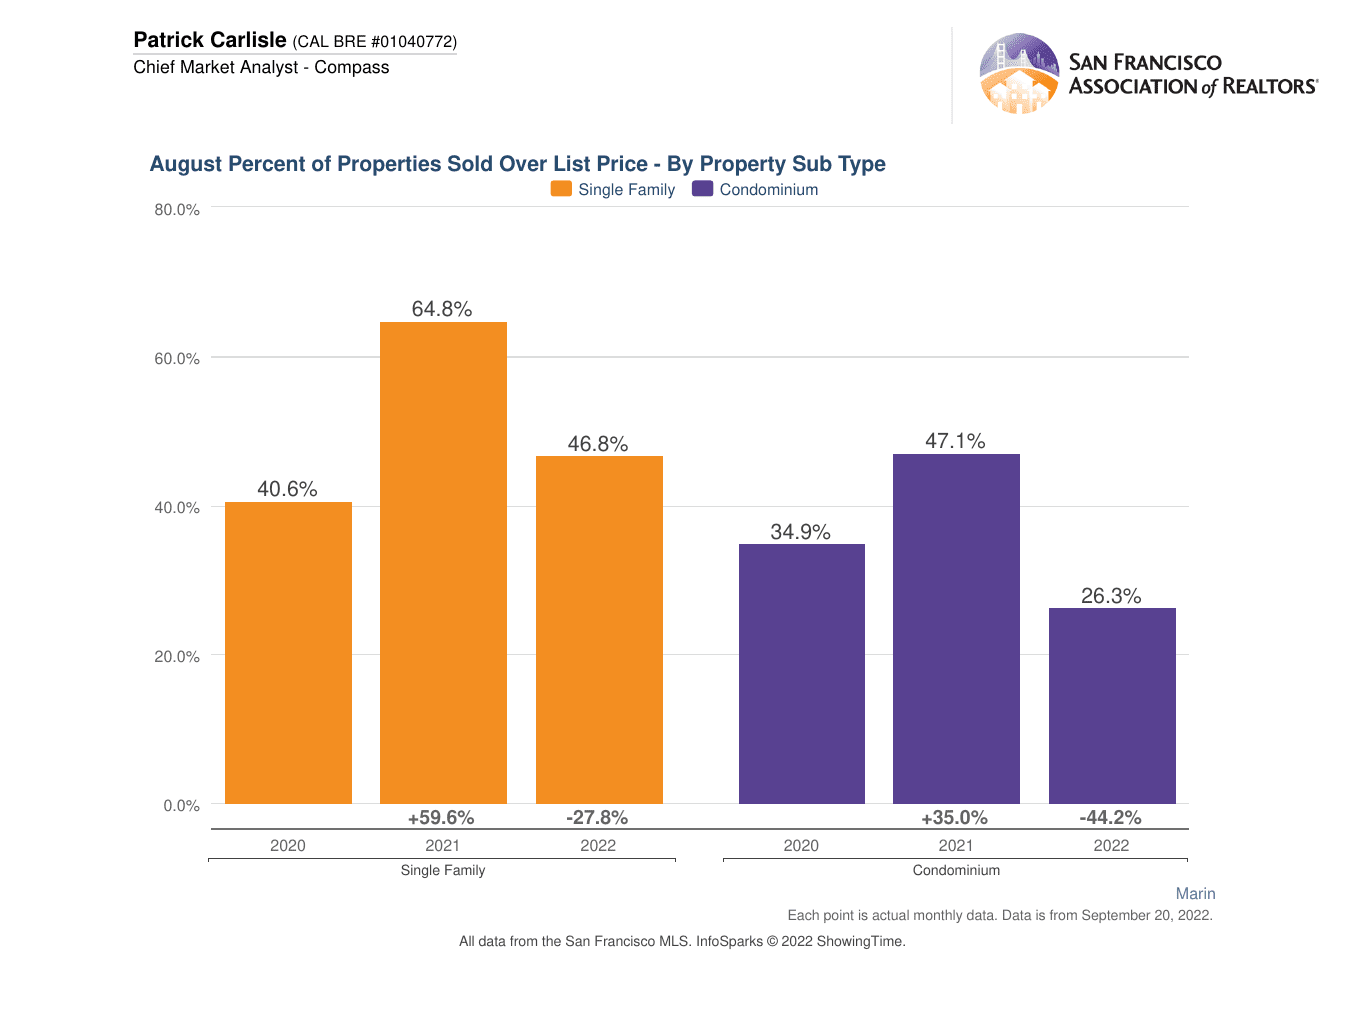
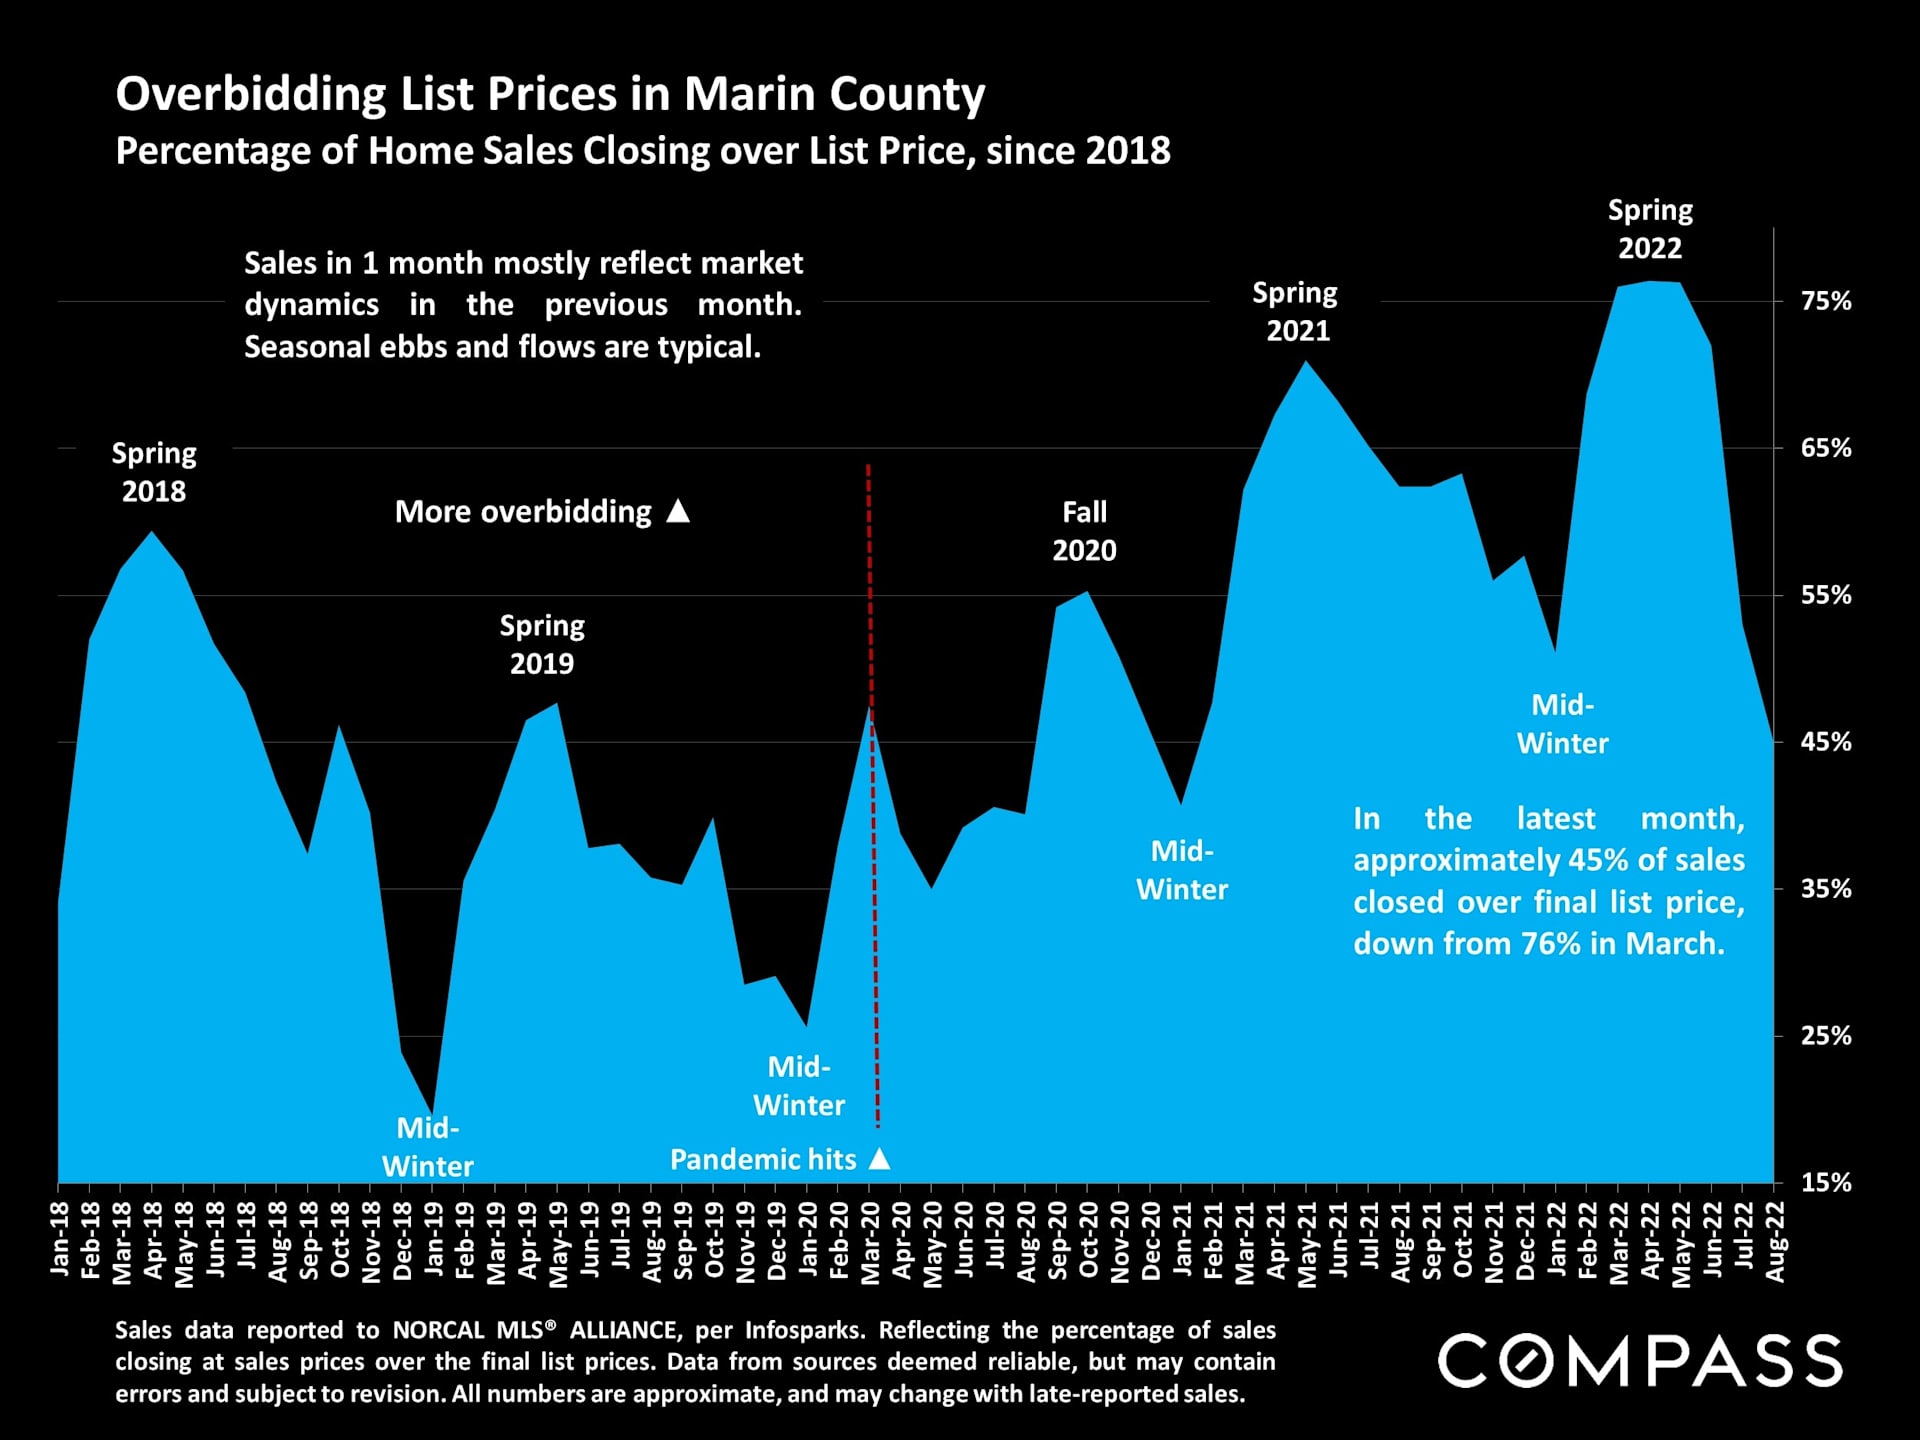
- Surprise: 45% of all sales in Marin did close escrow above asking price in August, compared to 76% in March 2022.
- A whopping 84 homes over $5.0 million have sold in Marin in 2022; 51 of those in Belvedere, Tiburon and Mill Valley, 12 of those sold at over $10.0 million; 64% more than pre-pandemic levels for over $5.0 million (see the SF Lux Market Report link below).
Still evolving September notes:
- The higher end over $5.0 million appears to be in a holding pattern. No chart yet, but our Manager reported this week there are only 2 sales so far in the entire county in September over $5.0, compared to 7 in August.
- The Redfin article dated 9/16/22 on cash purchases reports 19.9% of all sales in SF are all cash. Google it. We await the final statistics now being collected, but the early report is approx. 30% of all sales in Marin remain all cash. Obviously this is a large contributing factor to our milder down trend. We will continue to follow this and report.
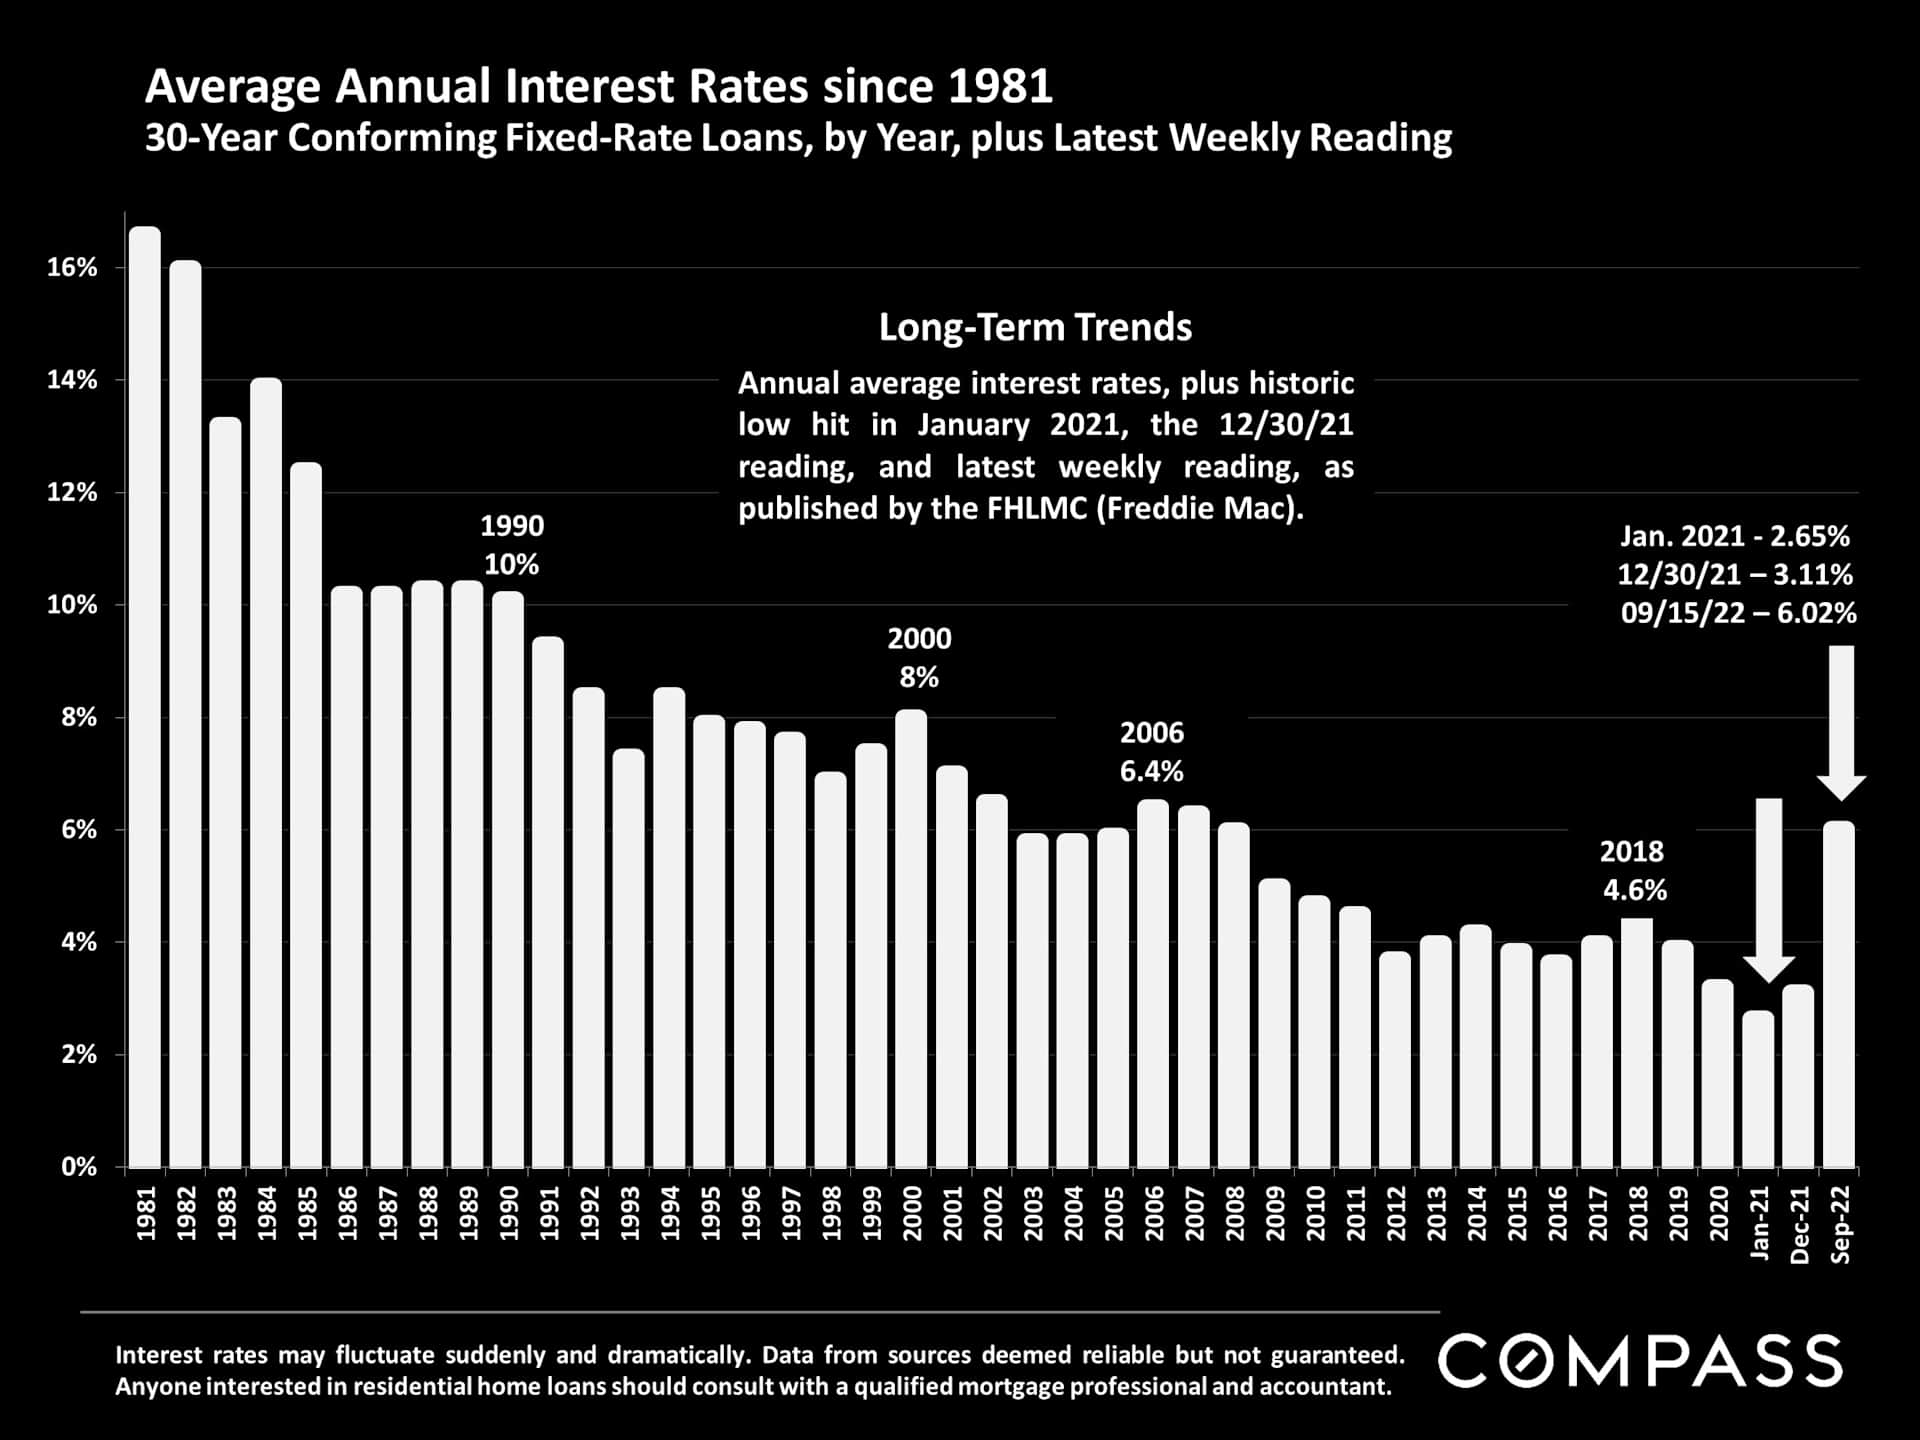
We will see how the Fed's latest news of a more sustained uptick in the cost of money impacts over the rest of 2022 and into 2023, but the facts so far suggest this: A better quality of life in Marin appears to matter to many and why we are likely to remain a comparatively positive outlier, beyond the greater macro reporting of media headlines. We will keep you posted!
Wishing you a spectacular early fall season!
Yours sincerely,
Michelle and Ronda