Happy Fall Dear Clients and Friends,
Sincere hopes our spectacular fall weather has warmed your hearts and spirits!
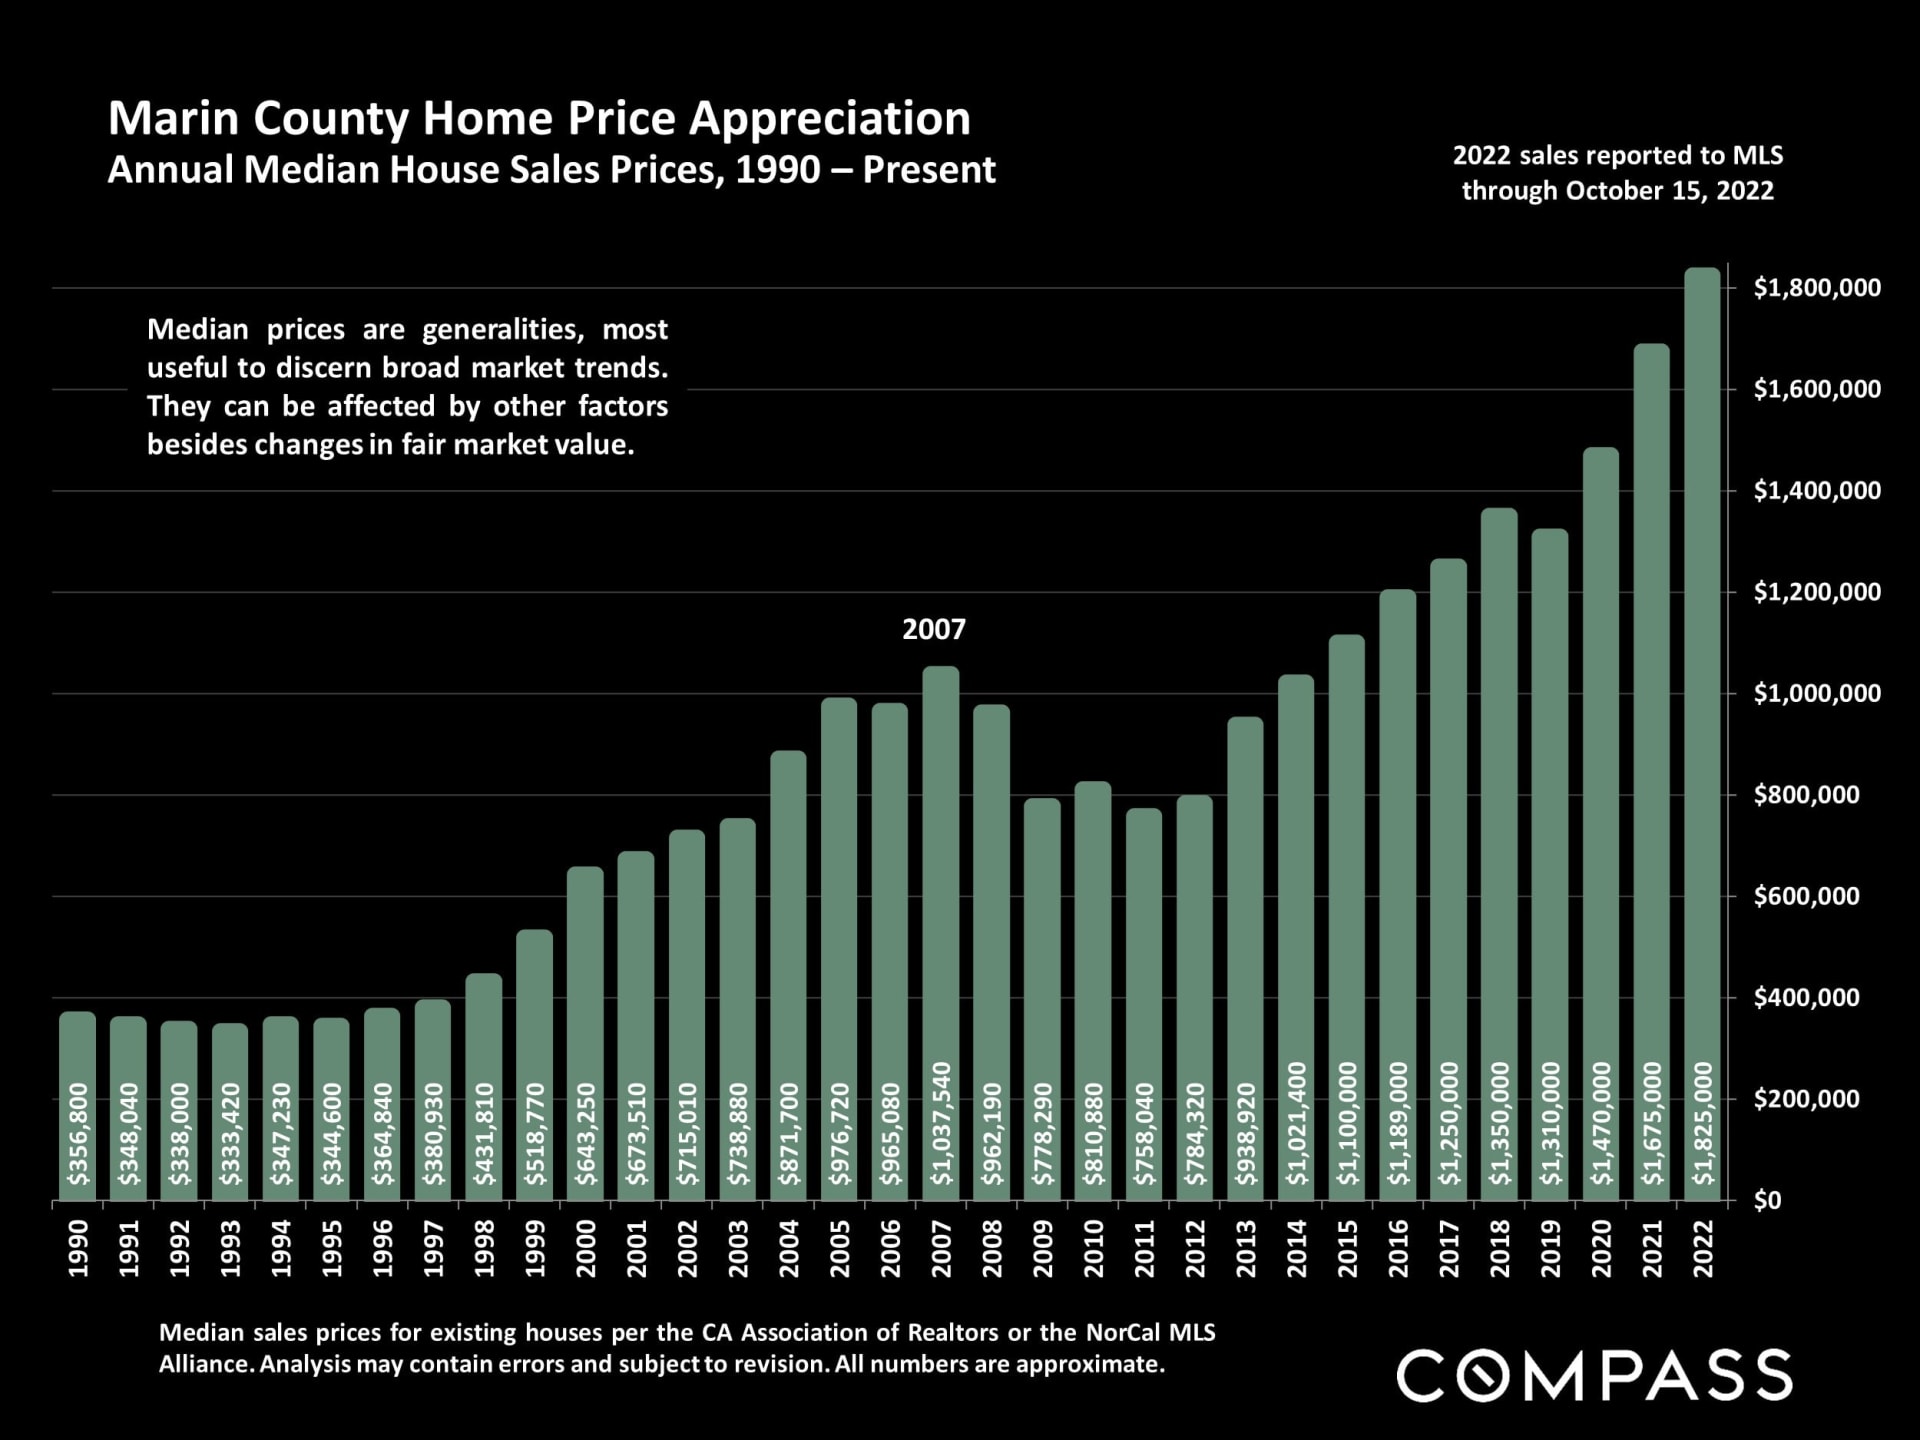
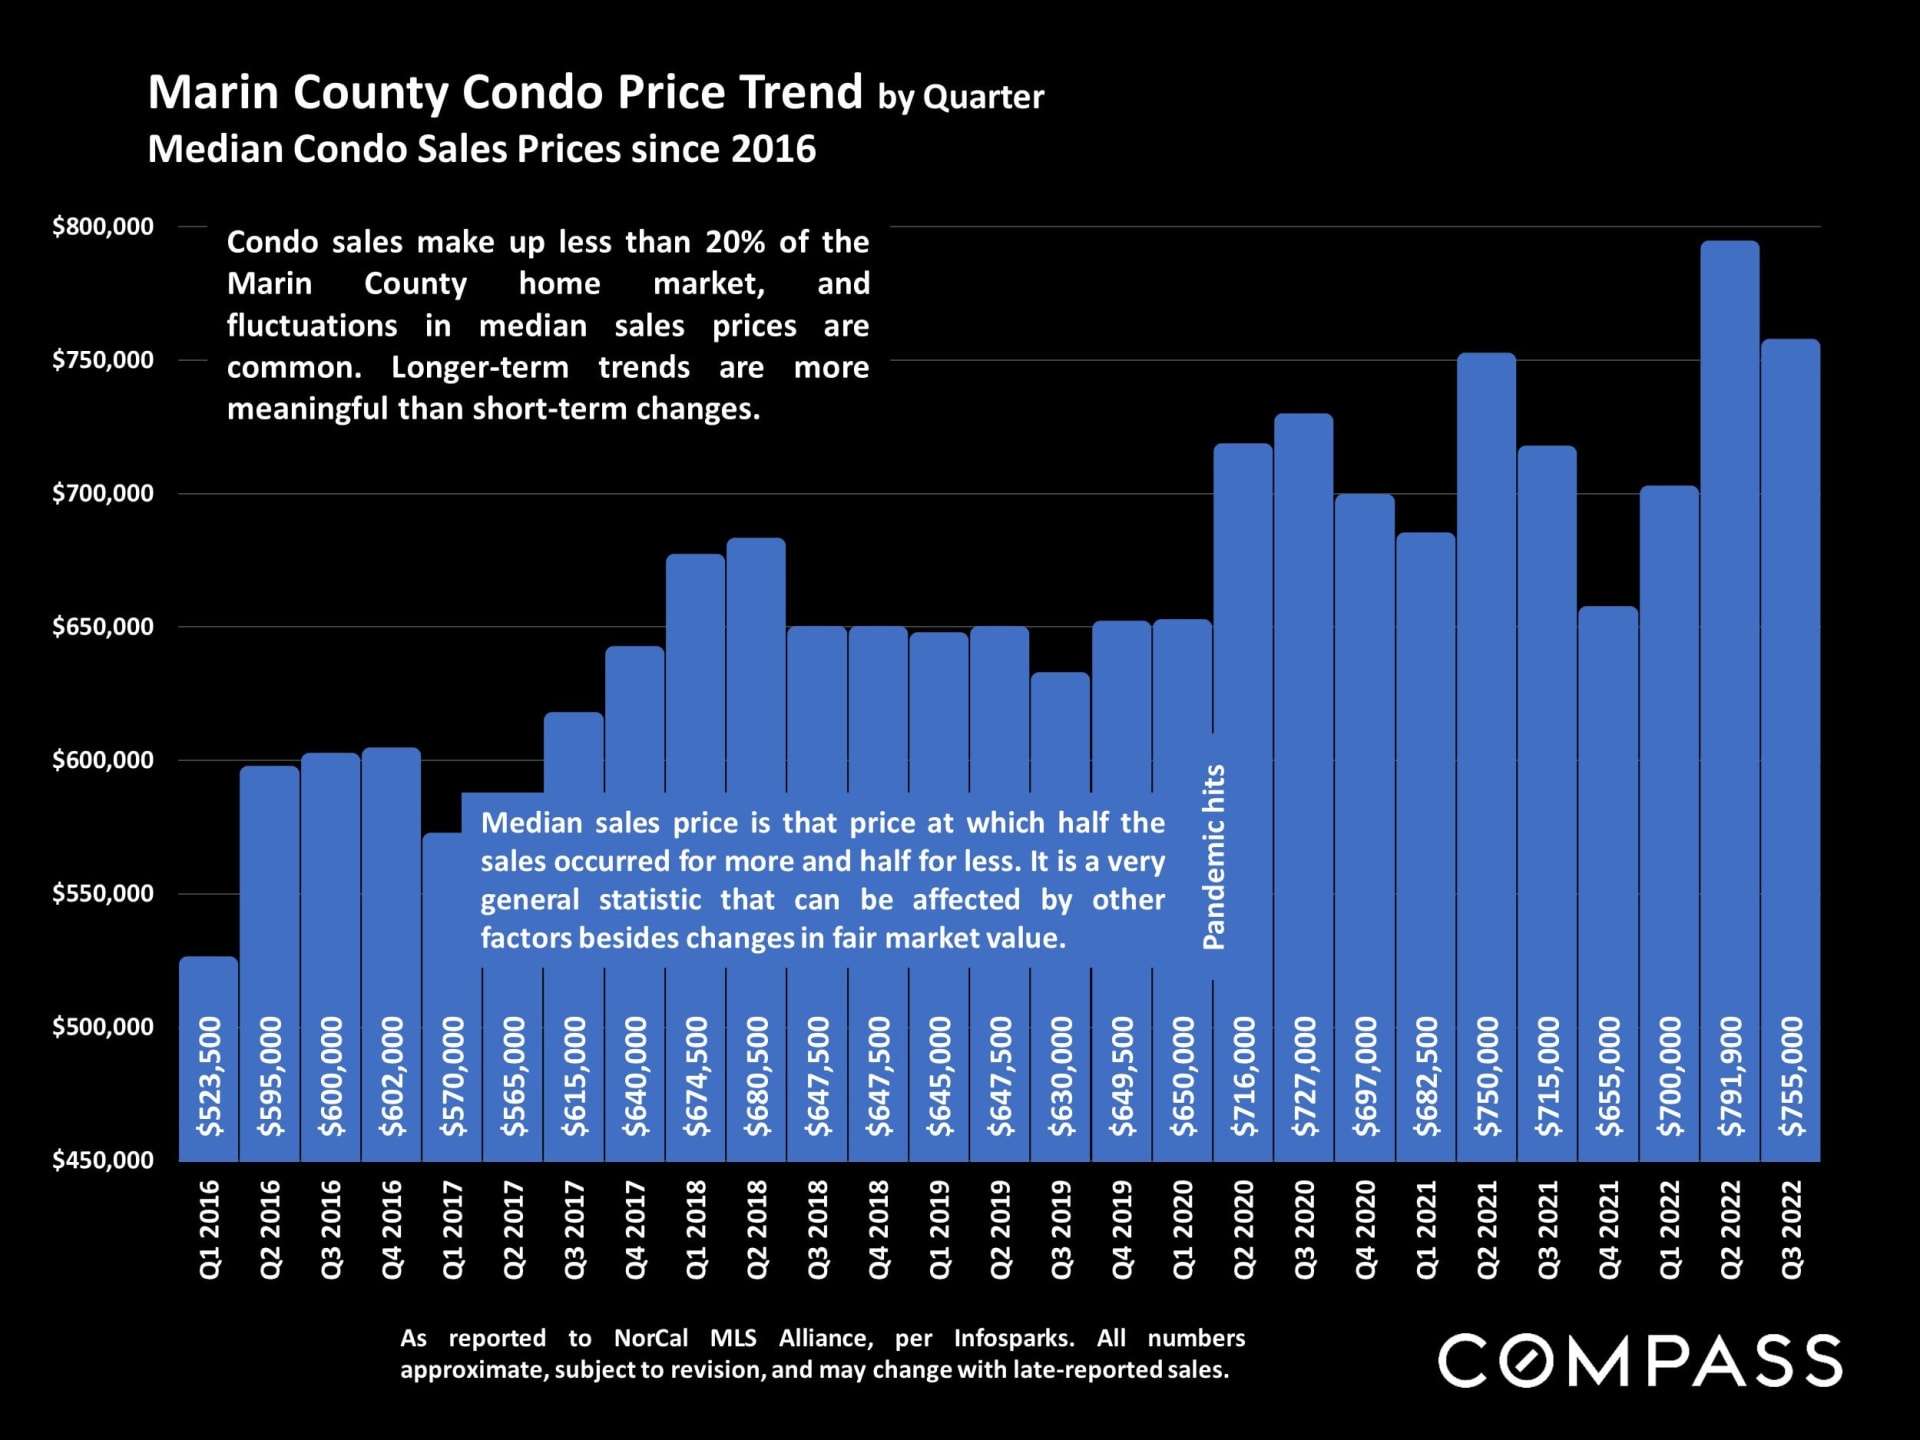
This month we begin by bringing you a chart of median home values in Marin since 1990. This chart tells the whole story on it's own: owning a home in Marin is a solid investment that has never demonstrated any regrets. There have been periods of value plateaus, but only one valley during the 2008-2011 recession debacle.
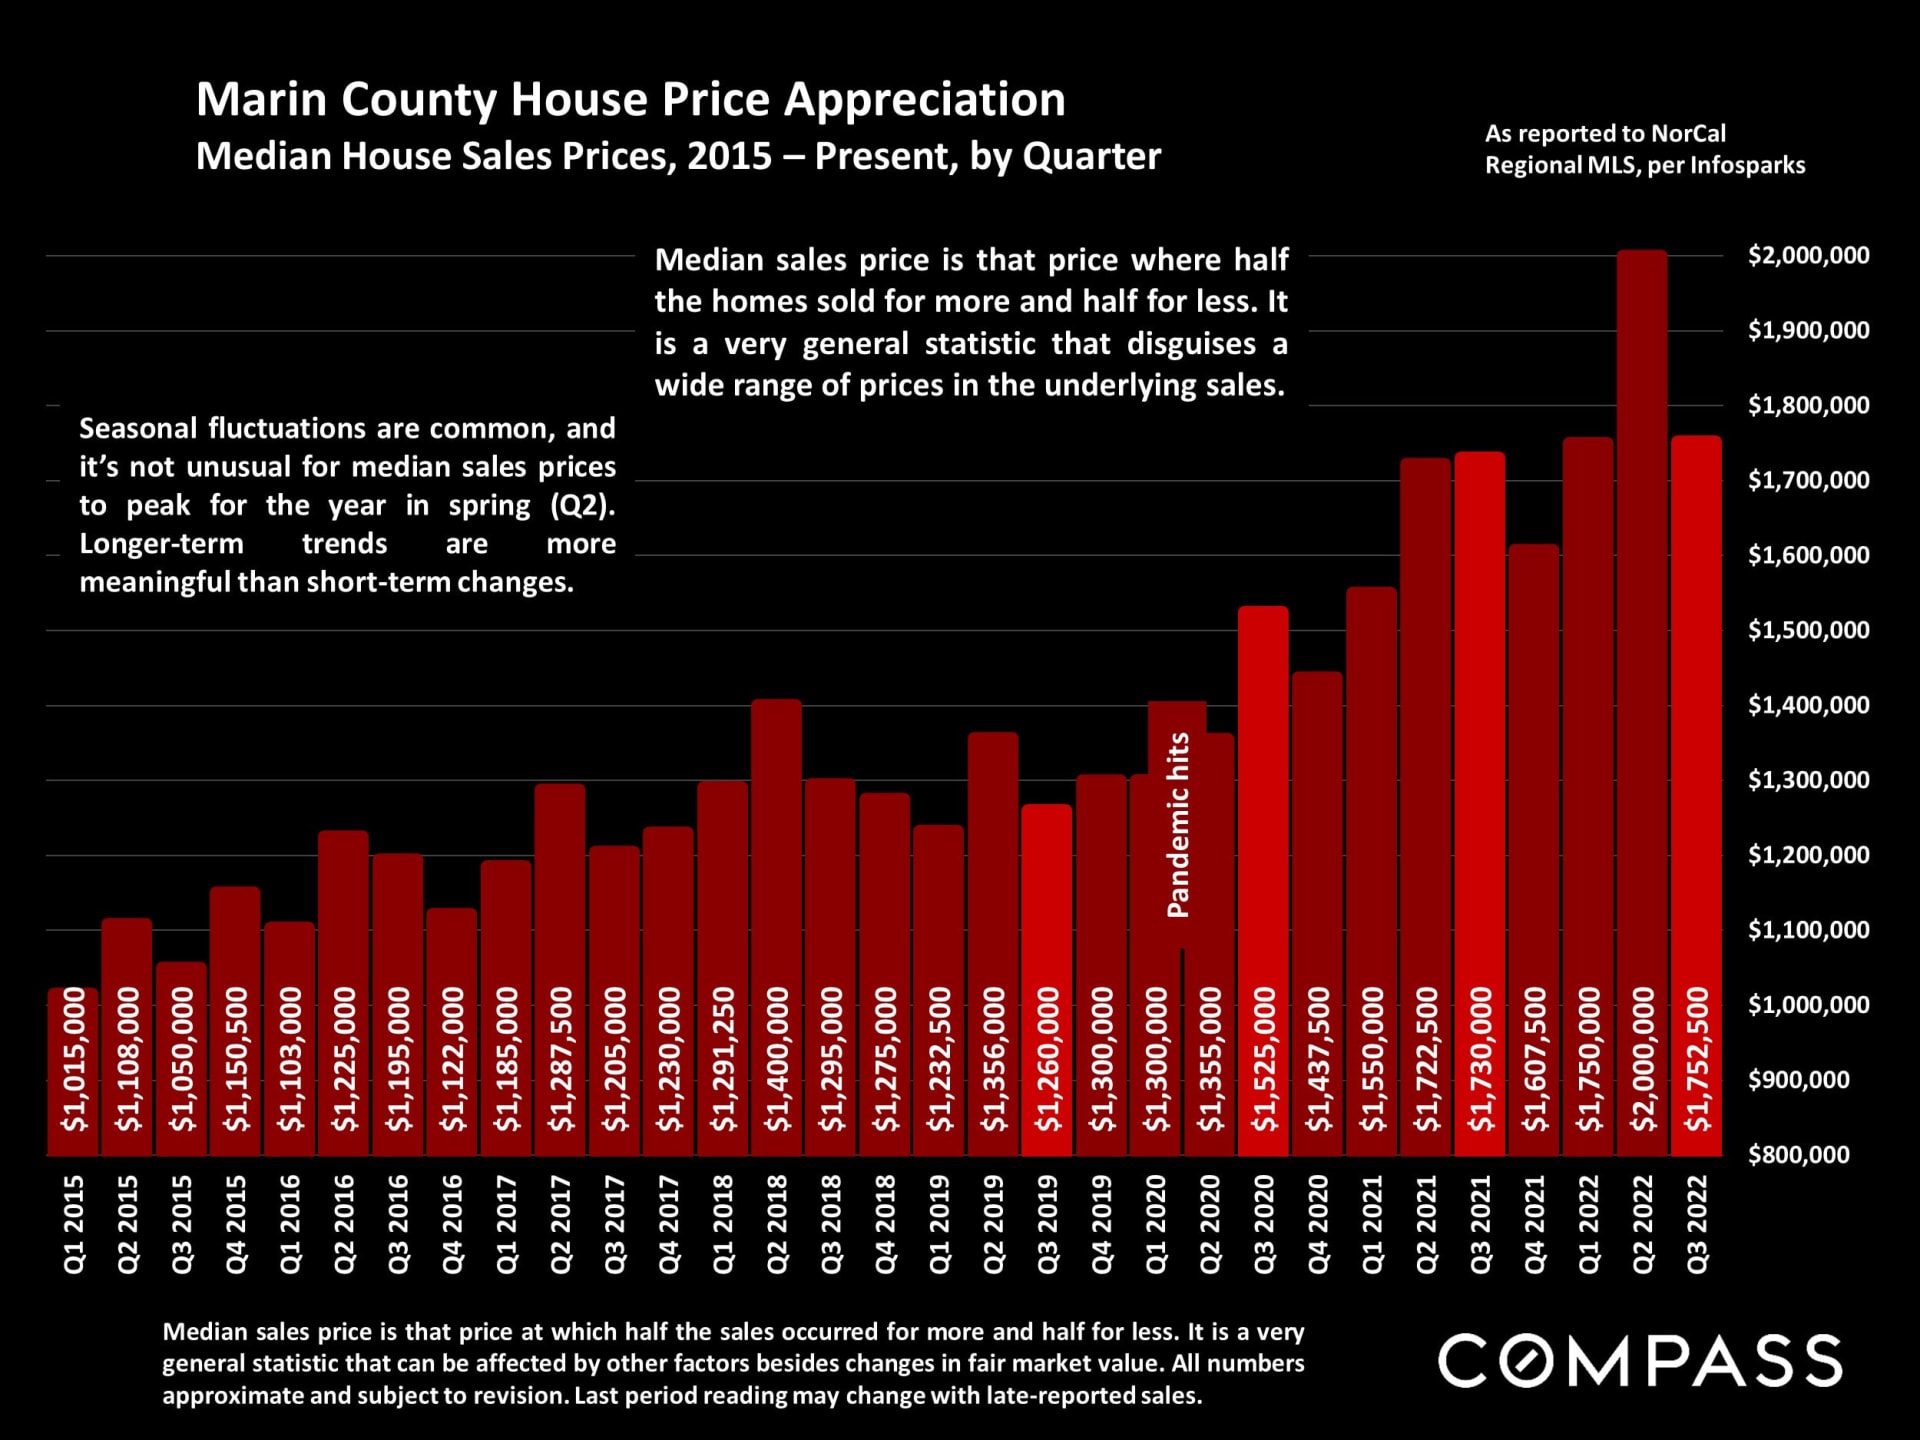
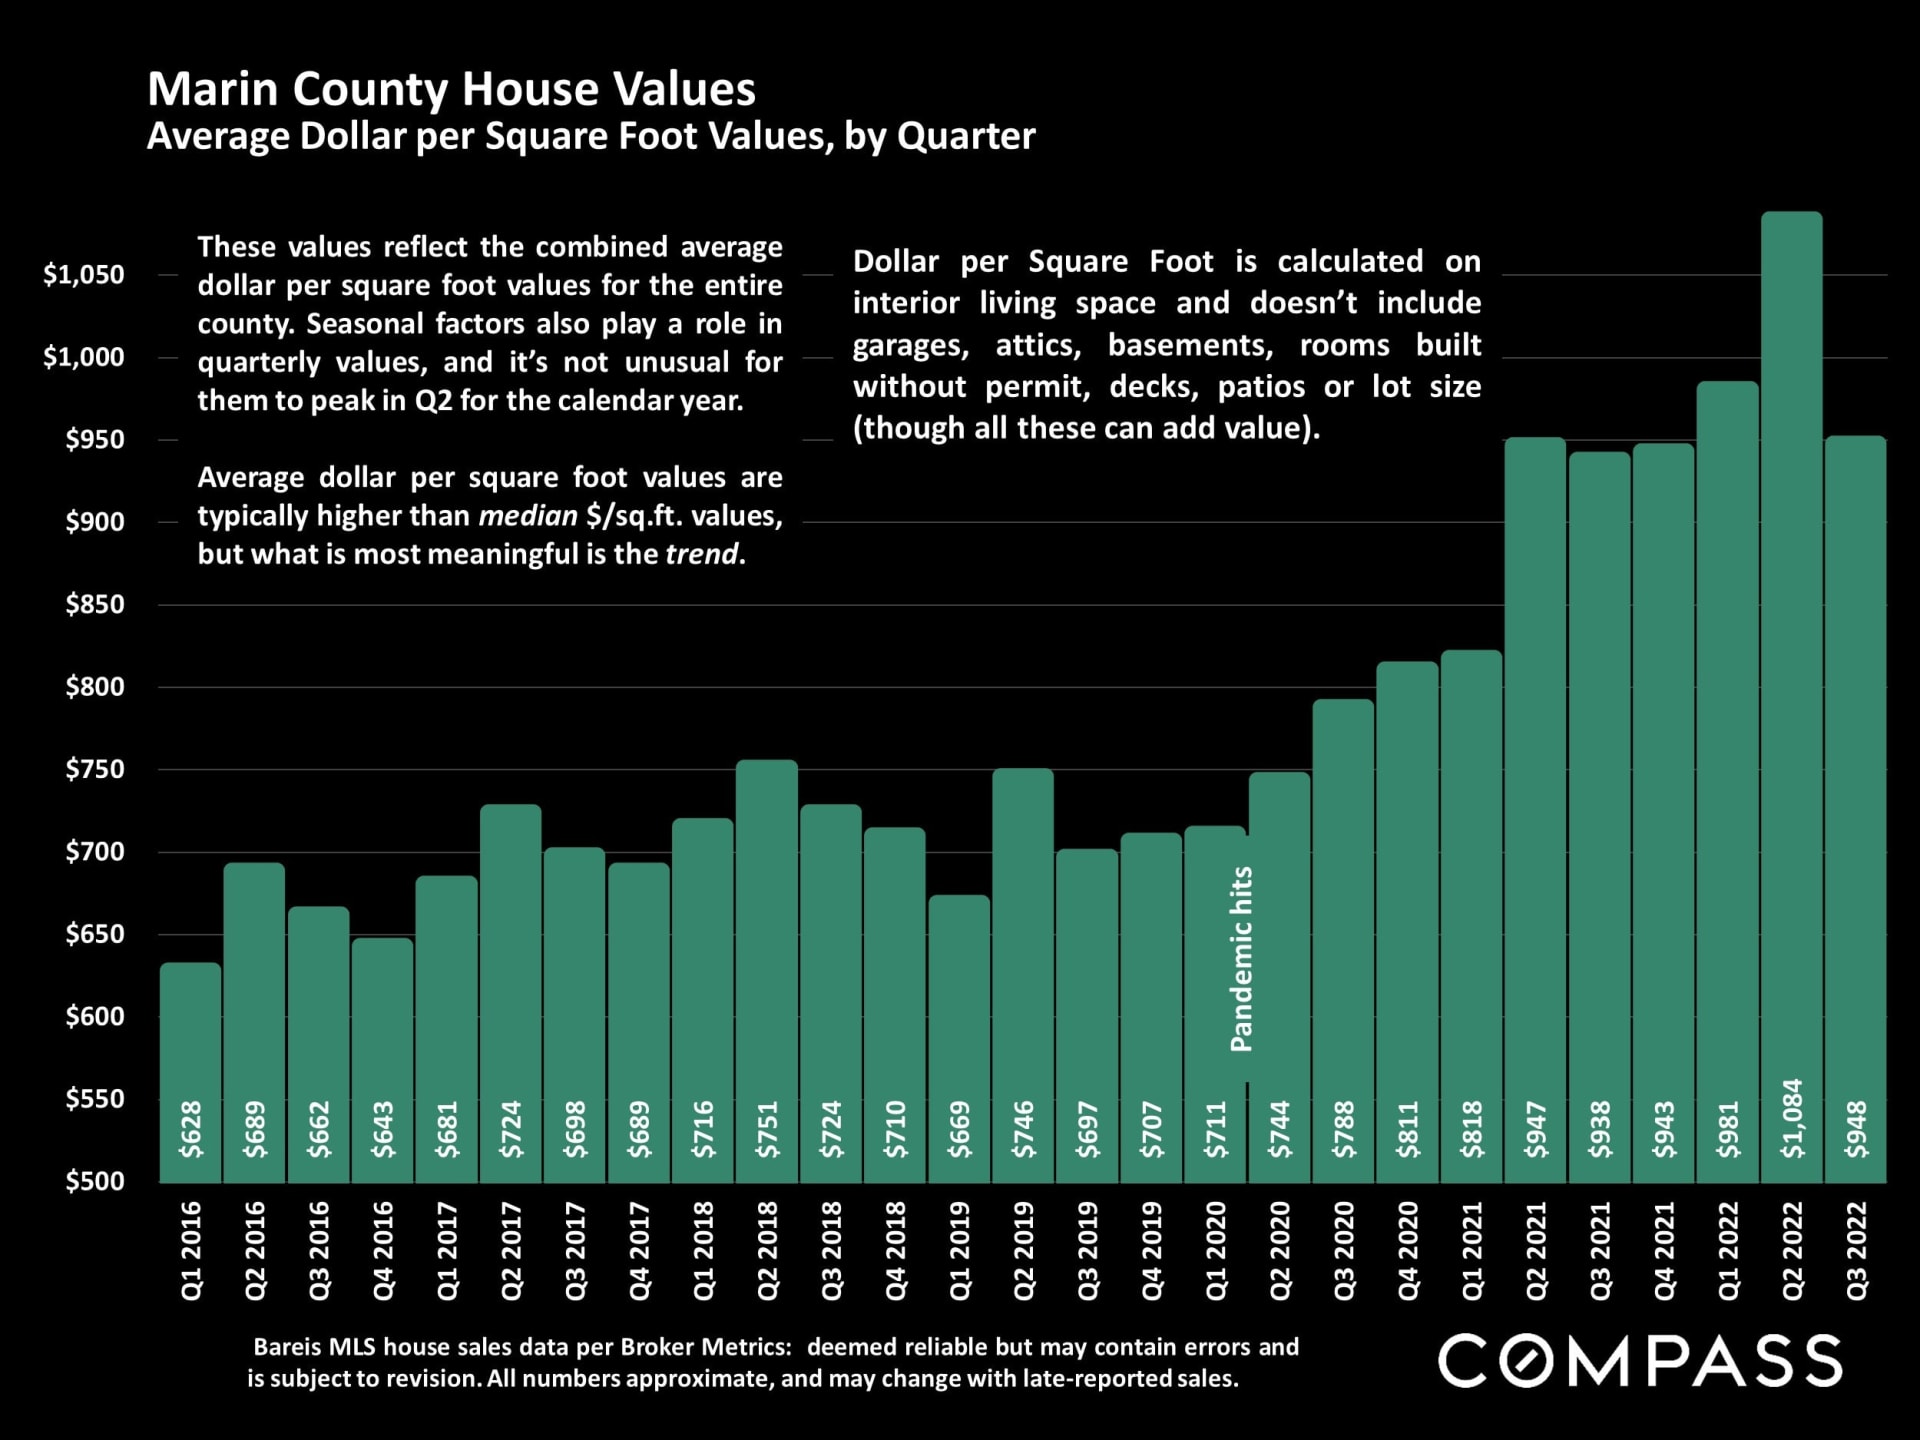
While the macro national news is gloomy...and we are not immune, we are due for a plateau and potential slight drop in values based on the decade long escalation since the solid rebound of our economy after the last recession...with values literally doubling since 2013. Again look at the long term chart...truly astounding value rise in the last 10 years.
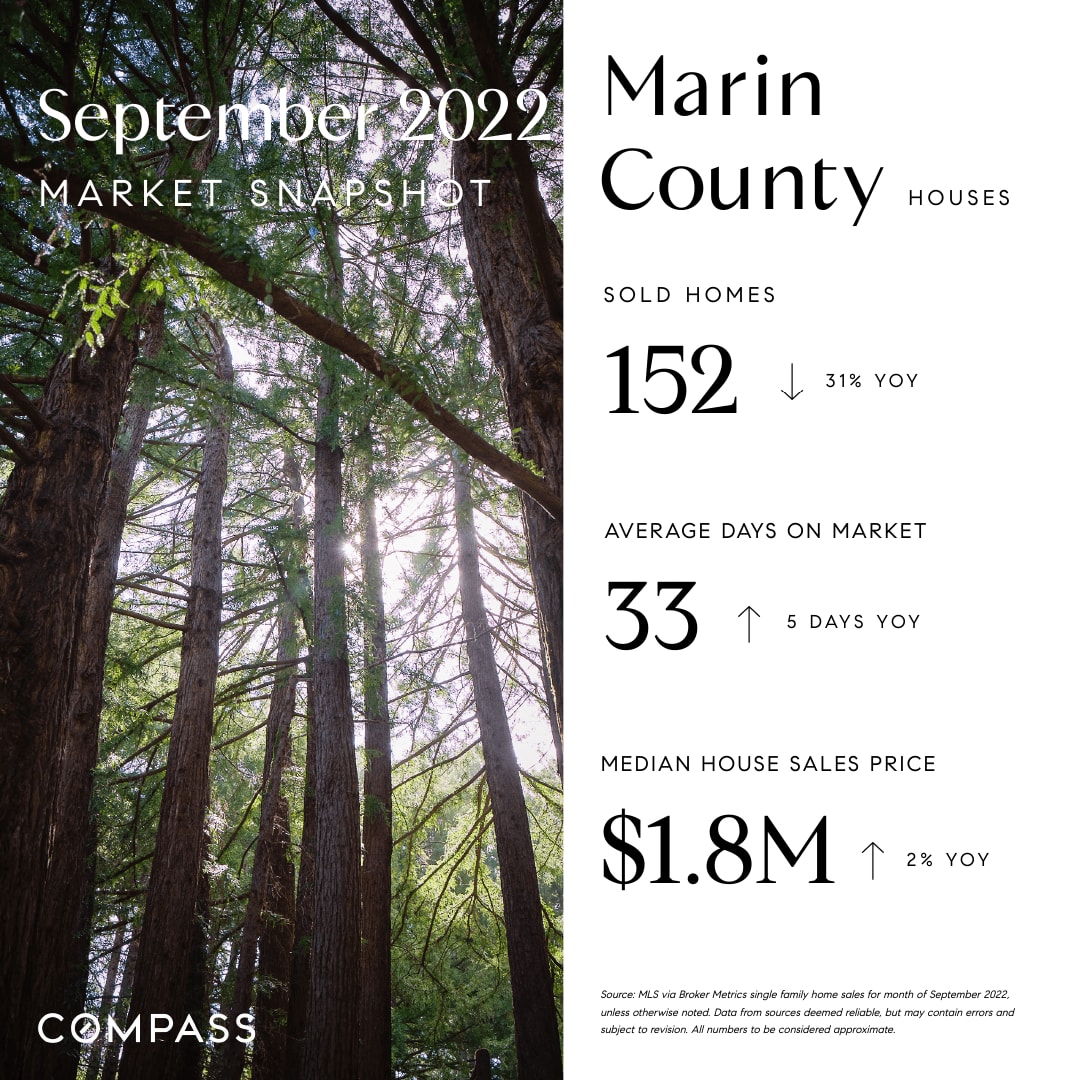
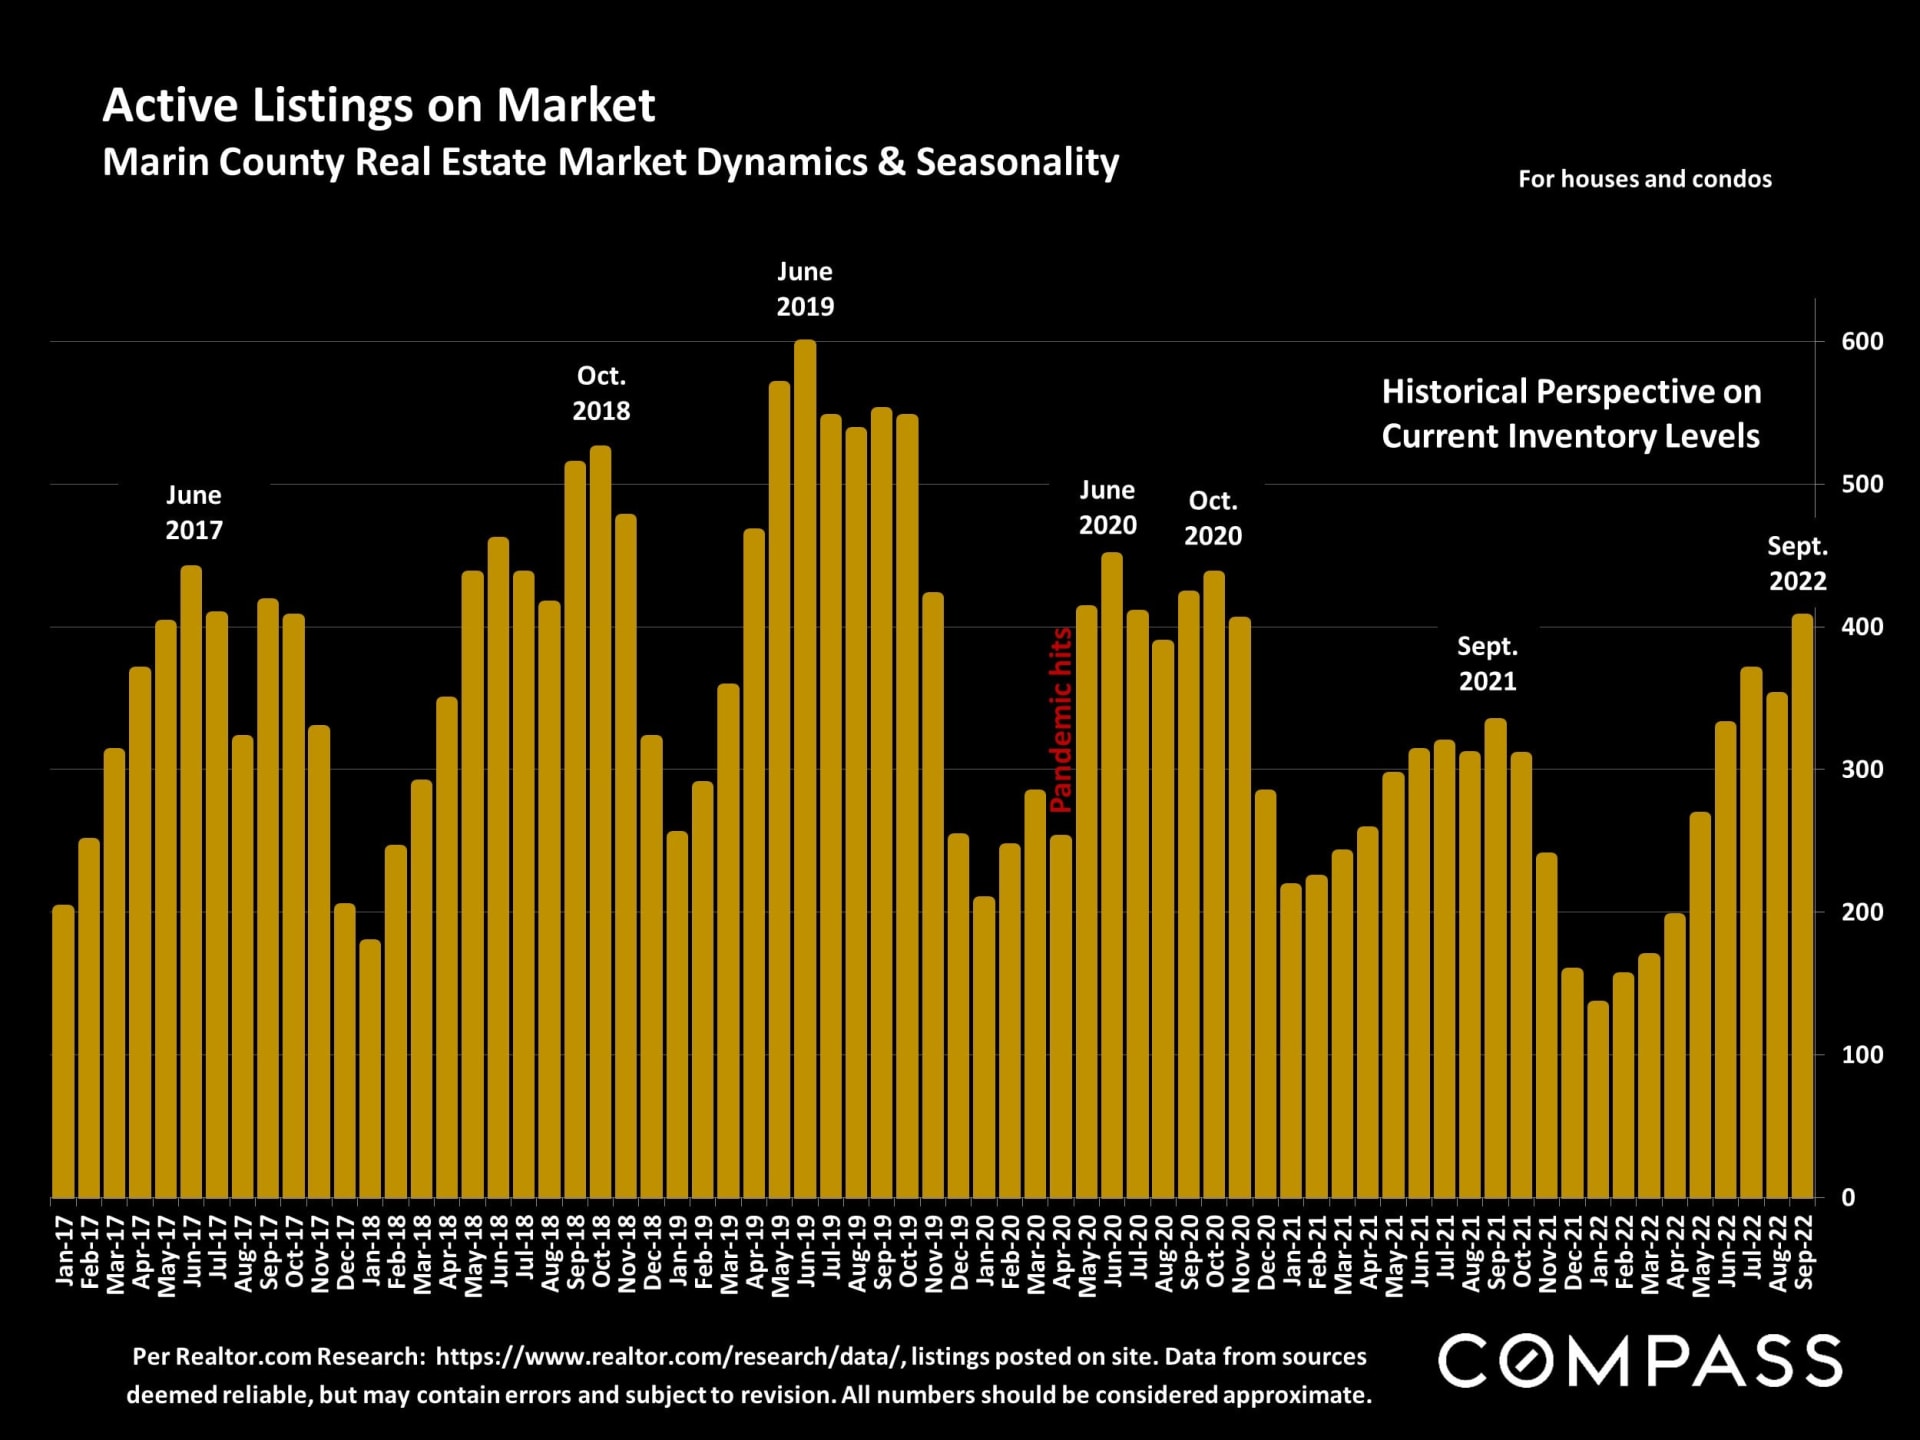
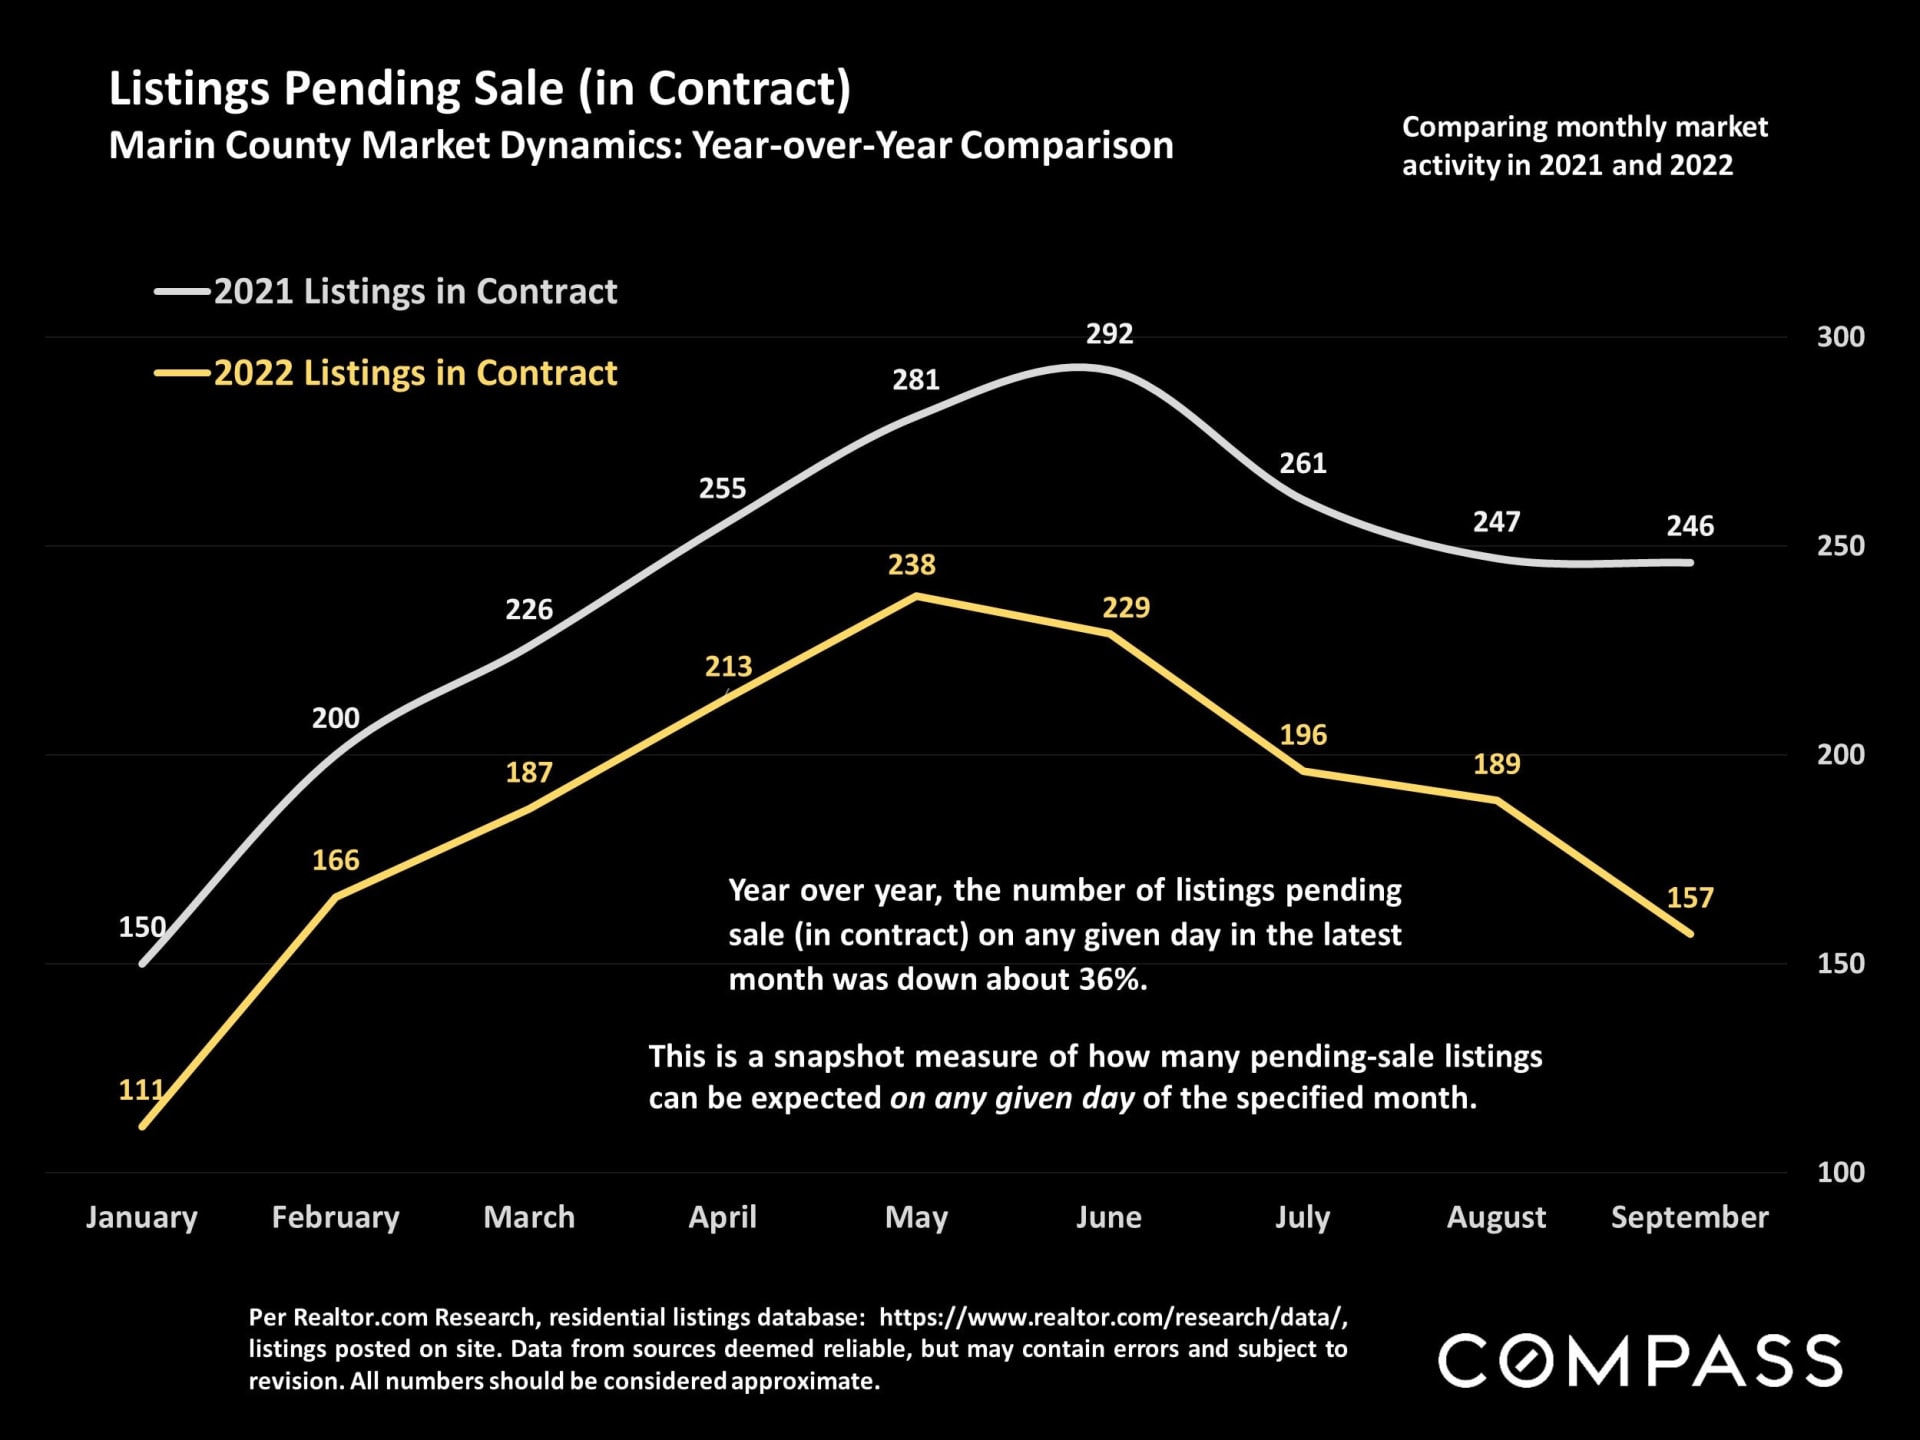
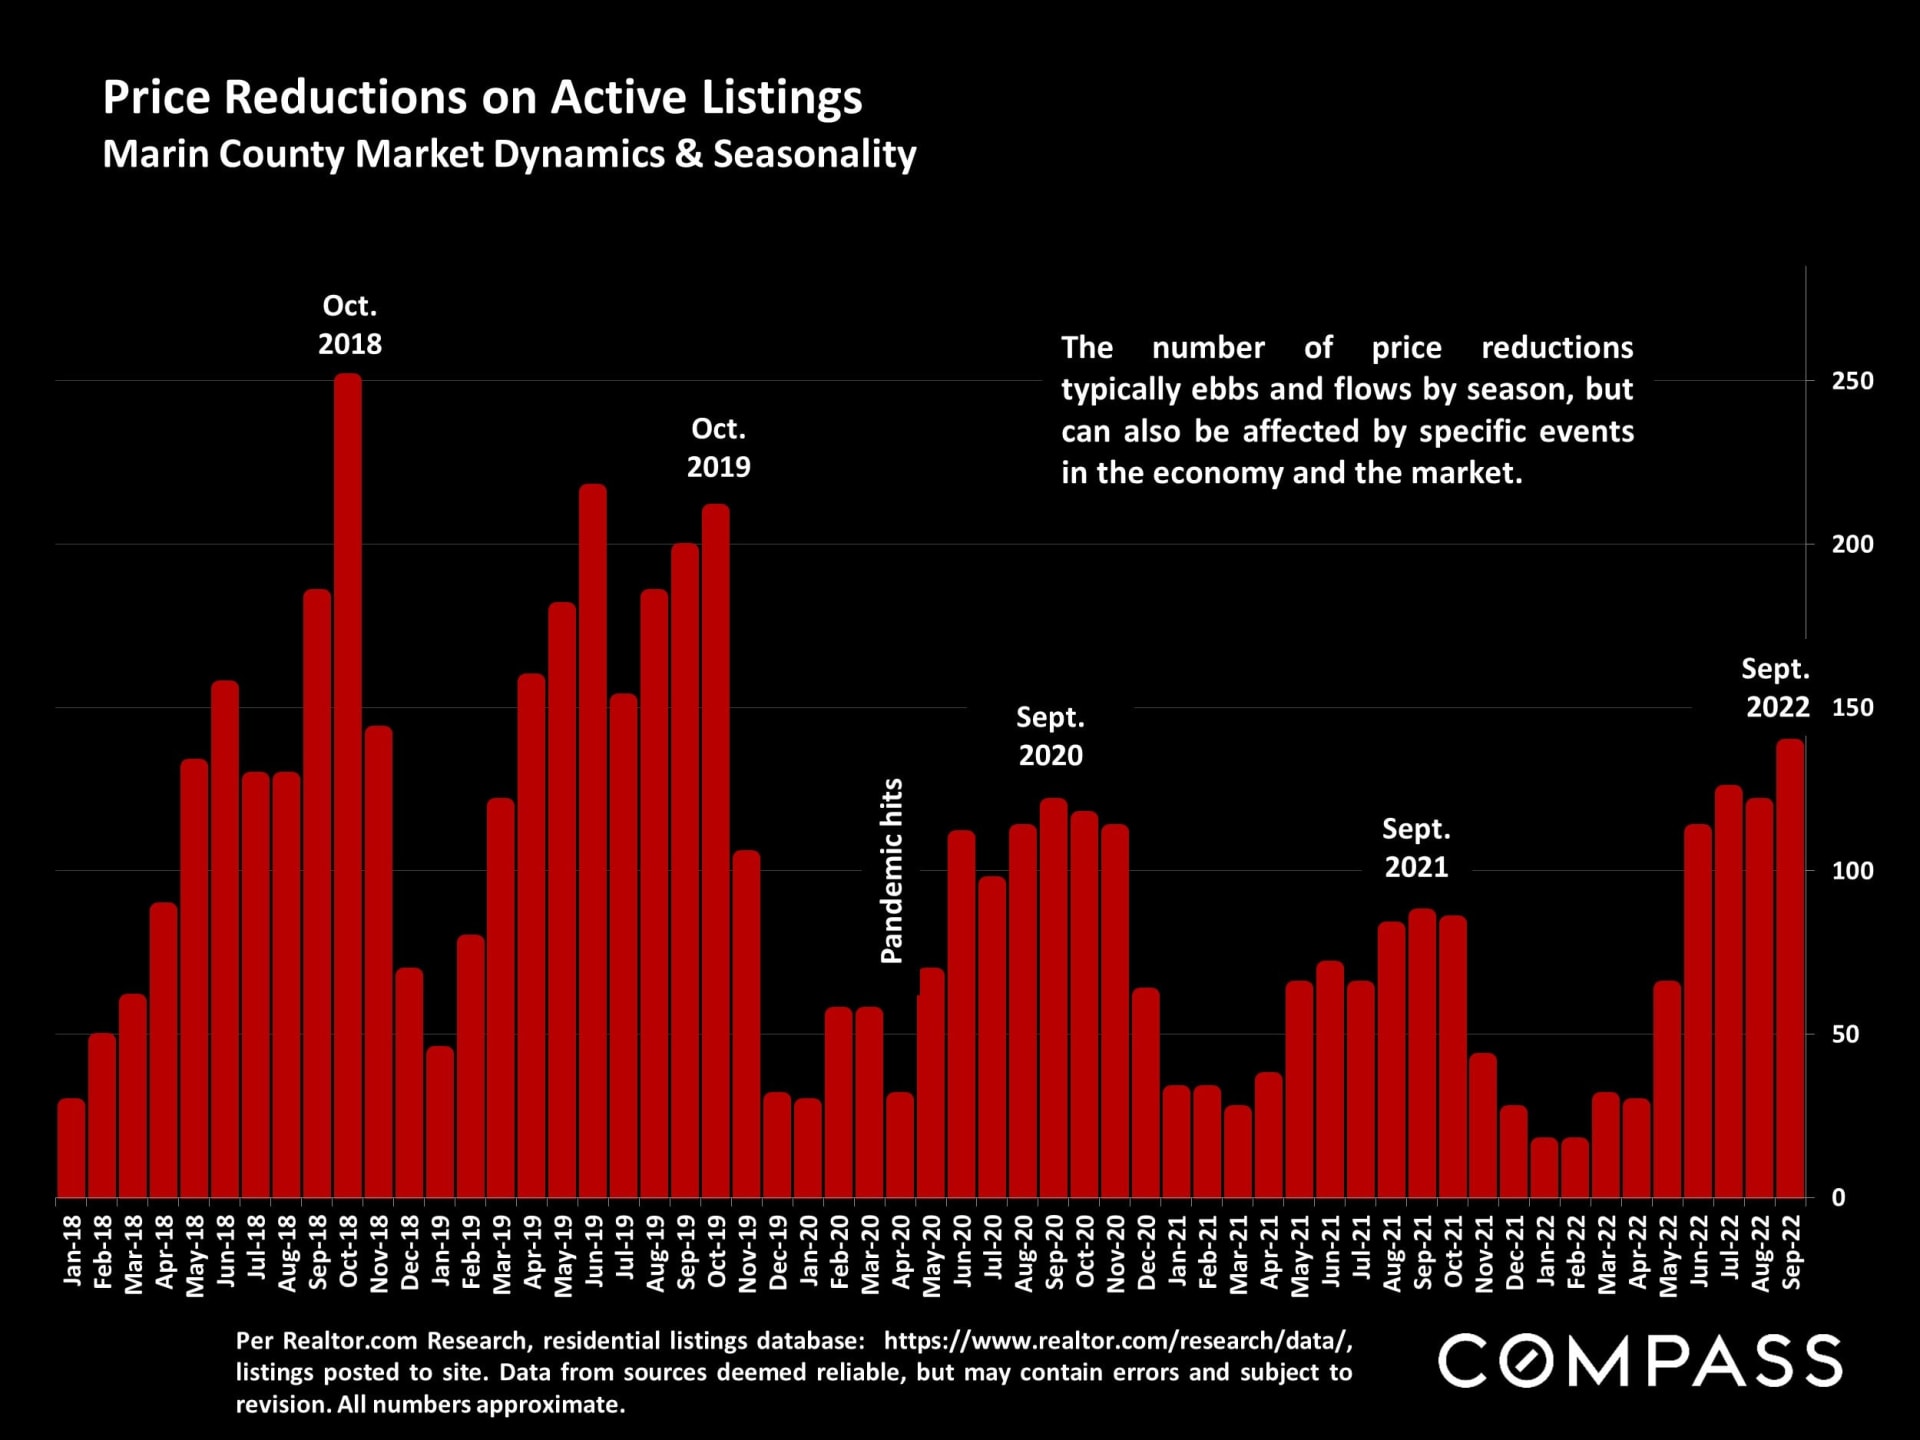
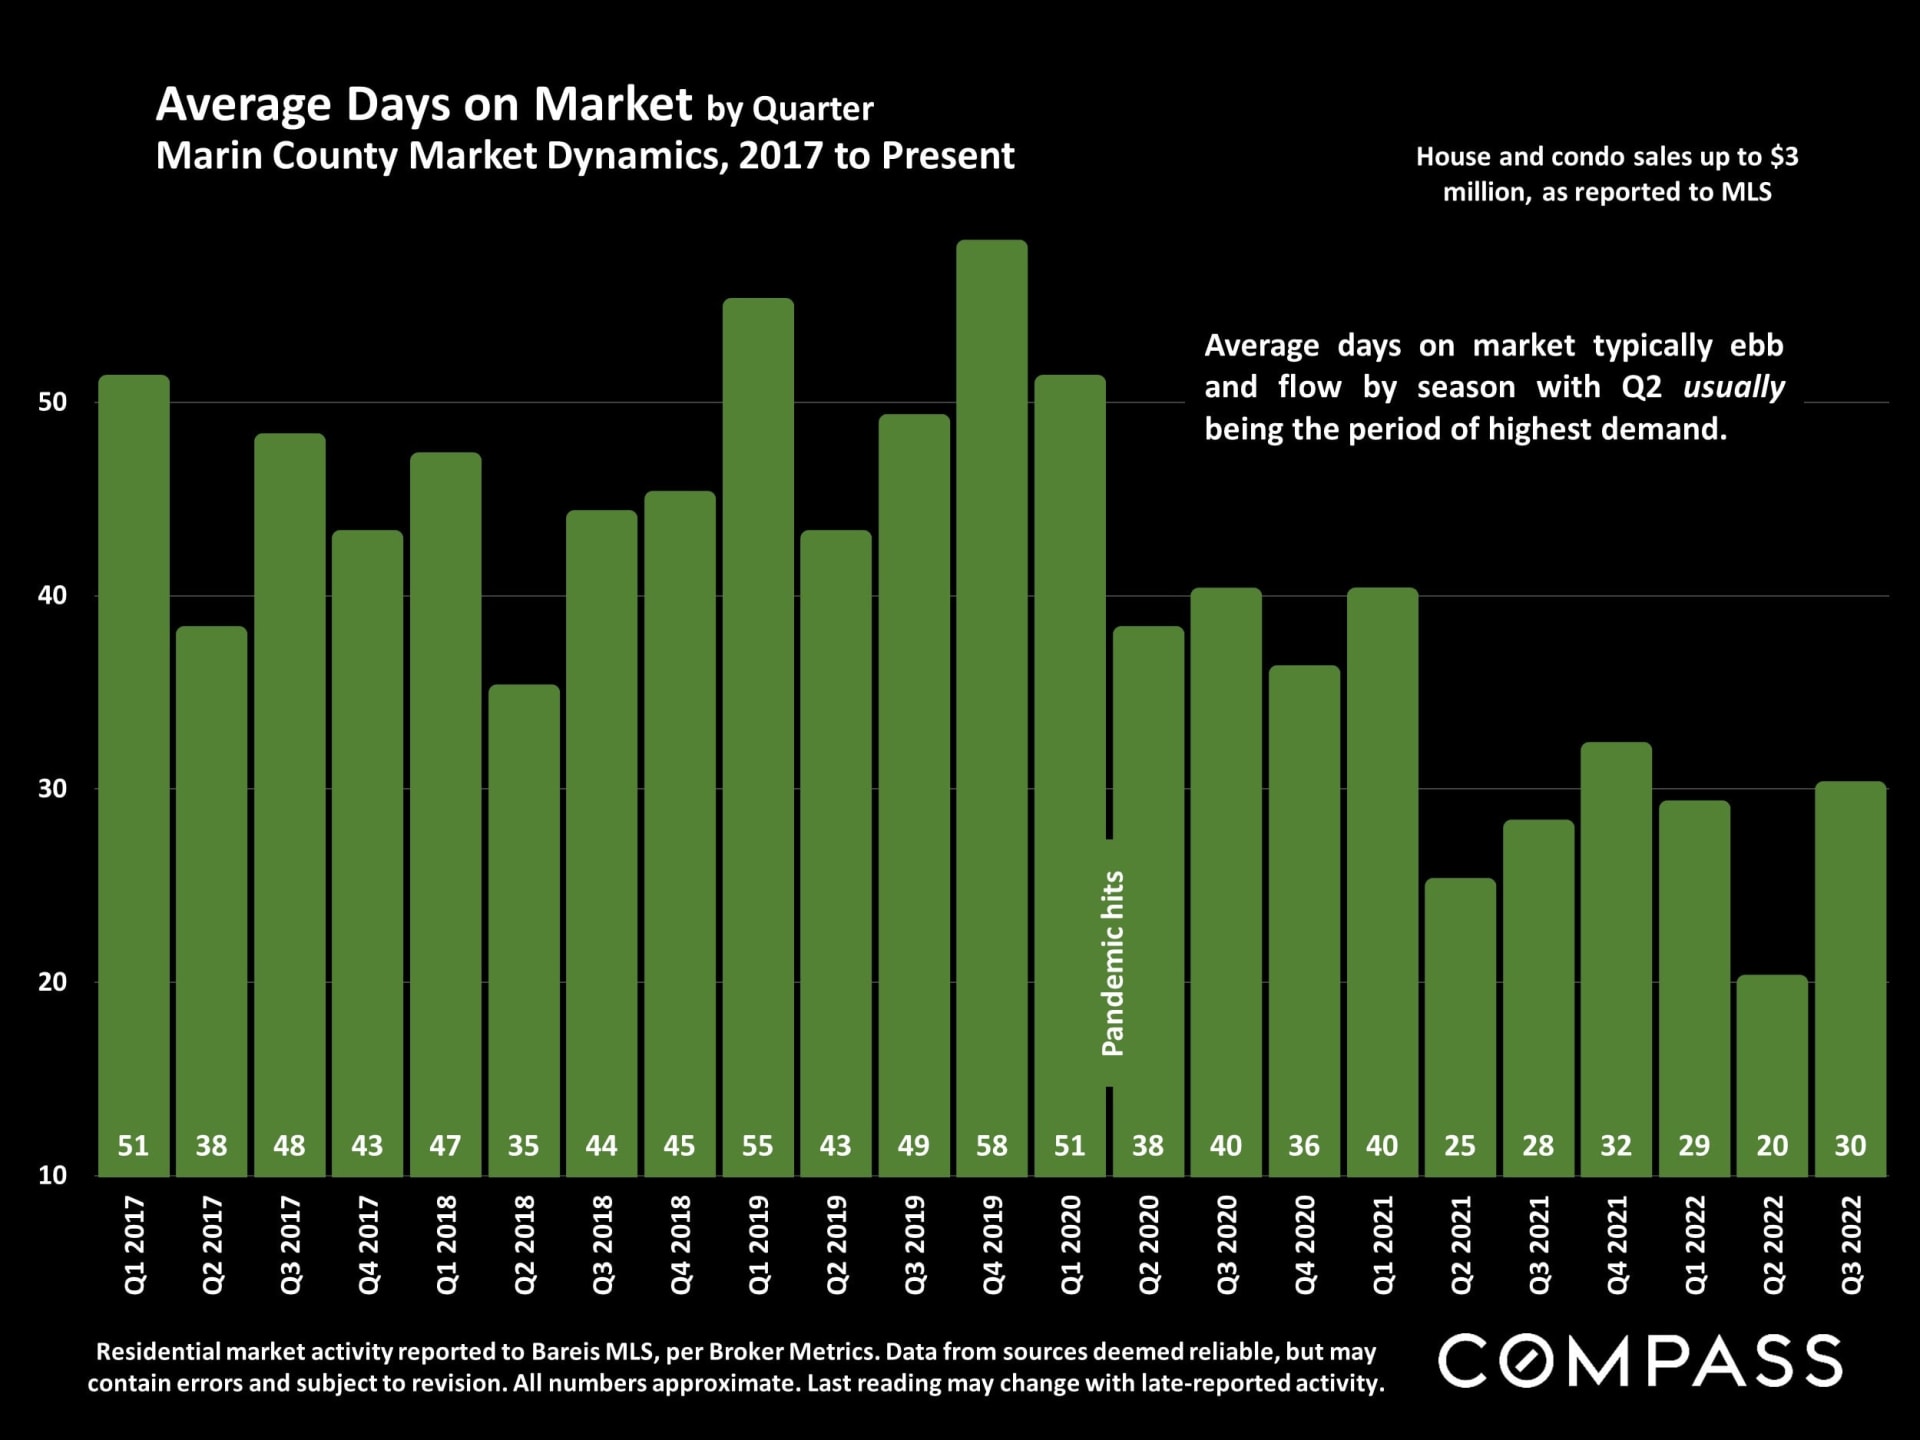
September brought little change from where median values were in August; still up 2% from January 2022, compared to 3% up in August. Where we see the effect is in numbers of homes sold in September; down 31% compared to September 2021. New listings and inventories are lower than in recent years and homes are taking longer to sell. Price reductions are numerous among properties not pricing using data from the last couple months.
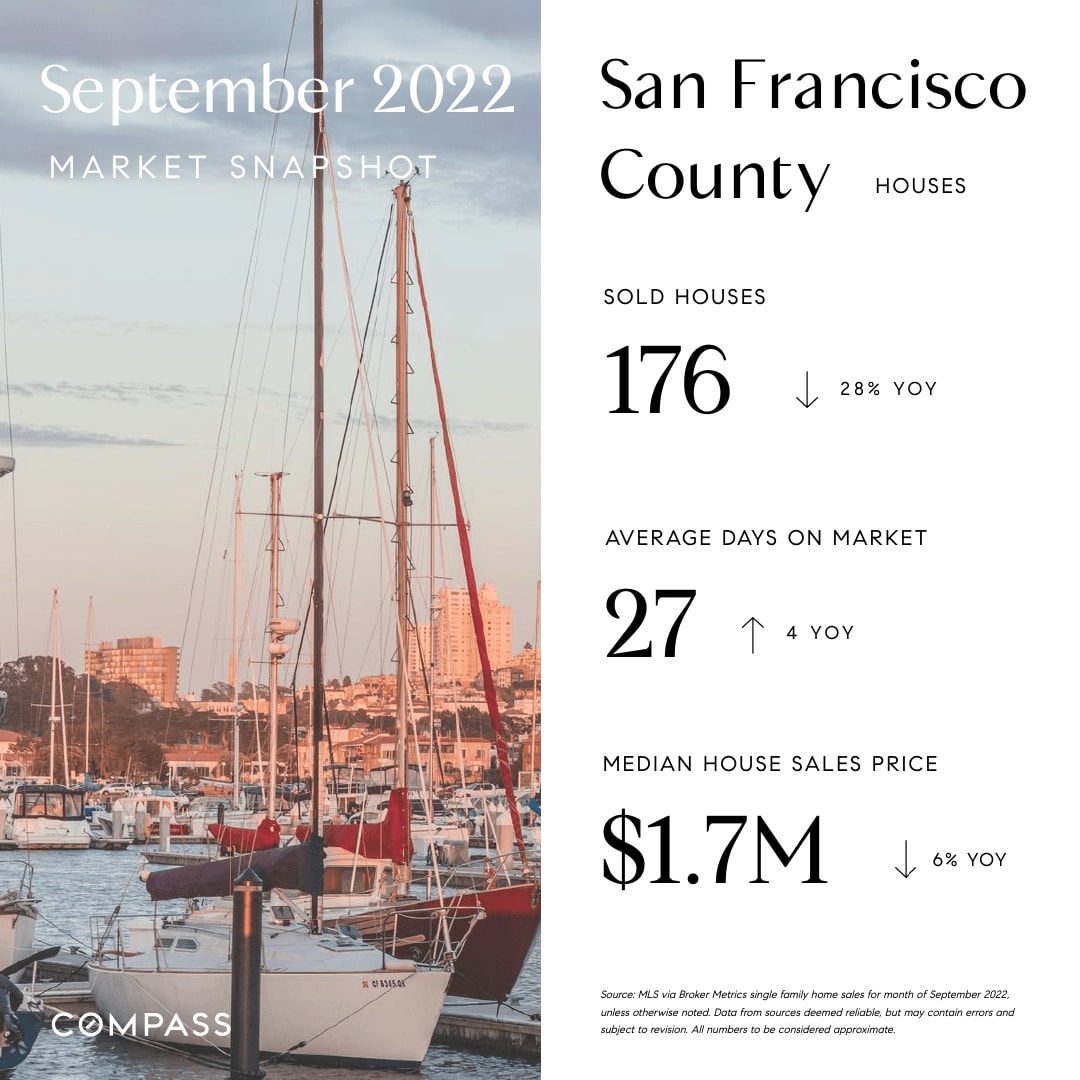
We are including the snapshot of San Francisco to reflect almost the exact same picture with numbers of homes sold in September being down 28%, however home values there are down 6% year over year.
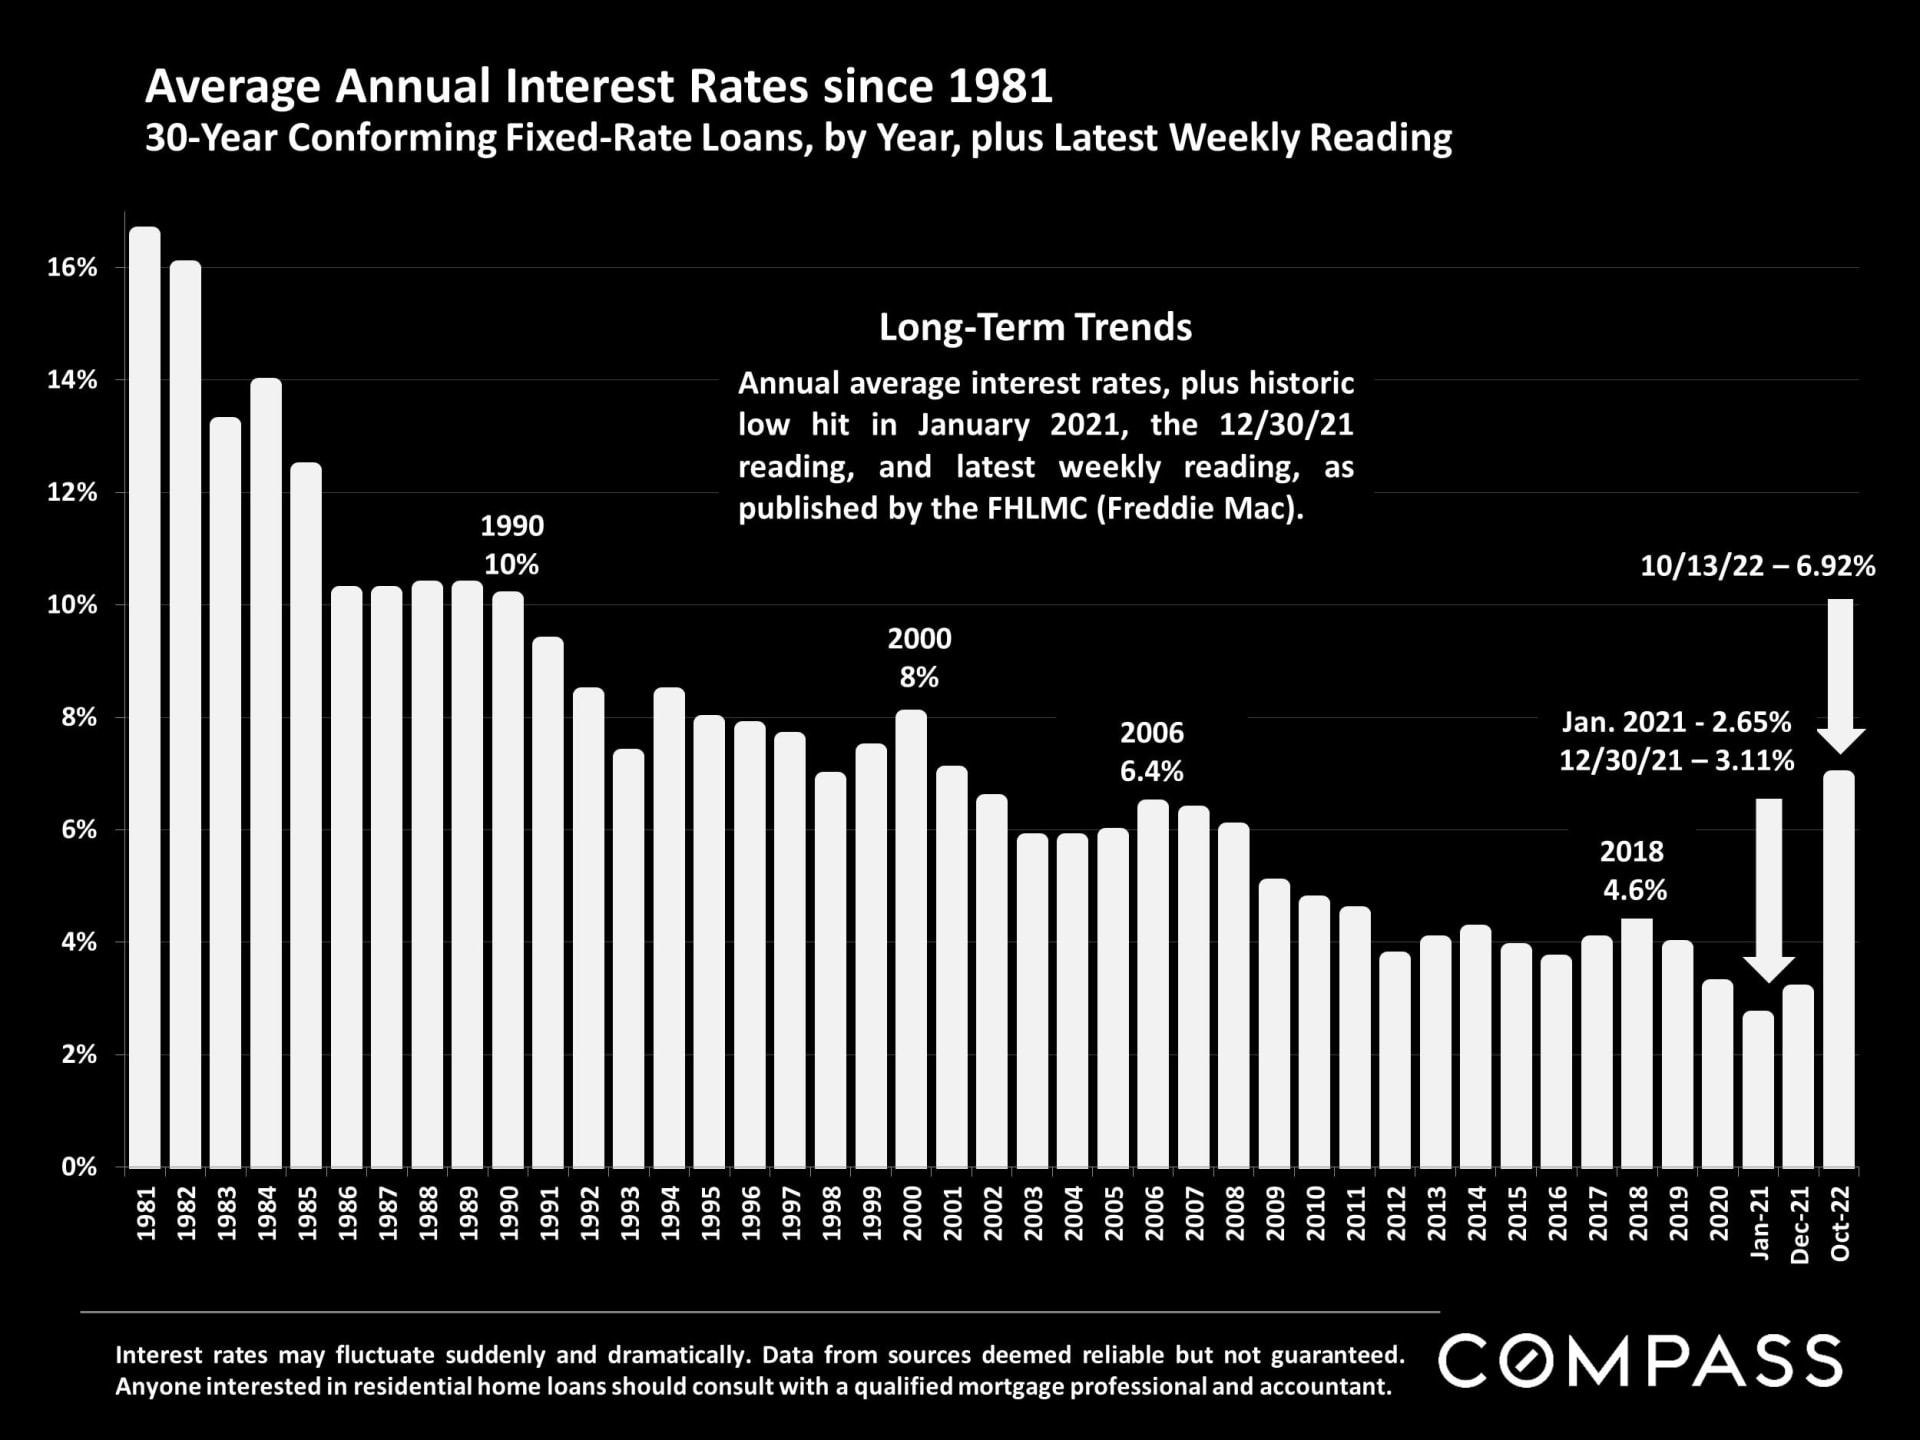
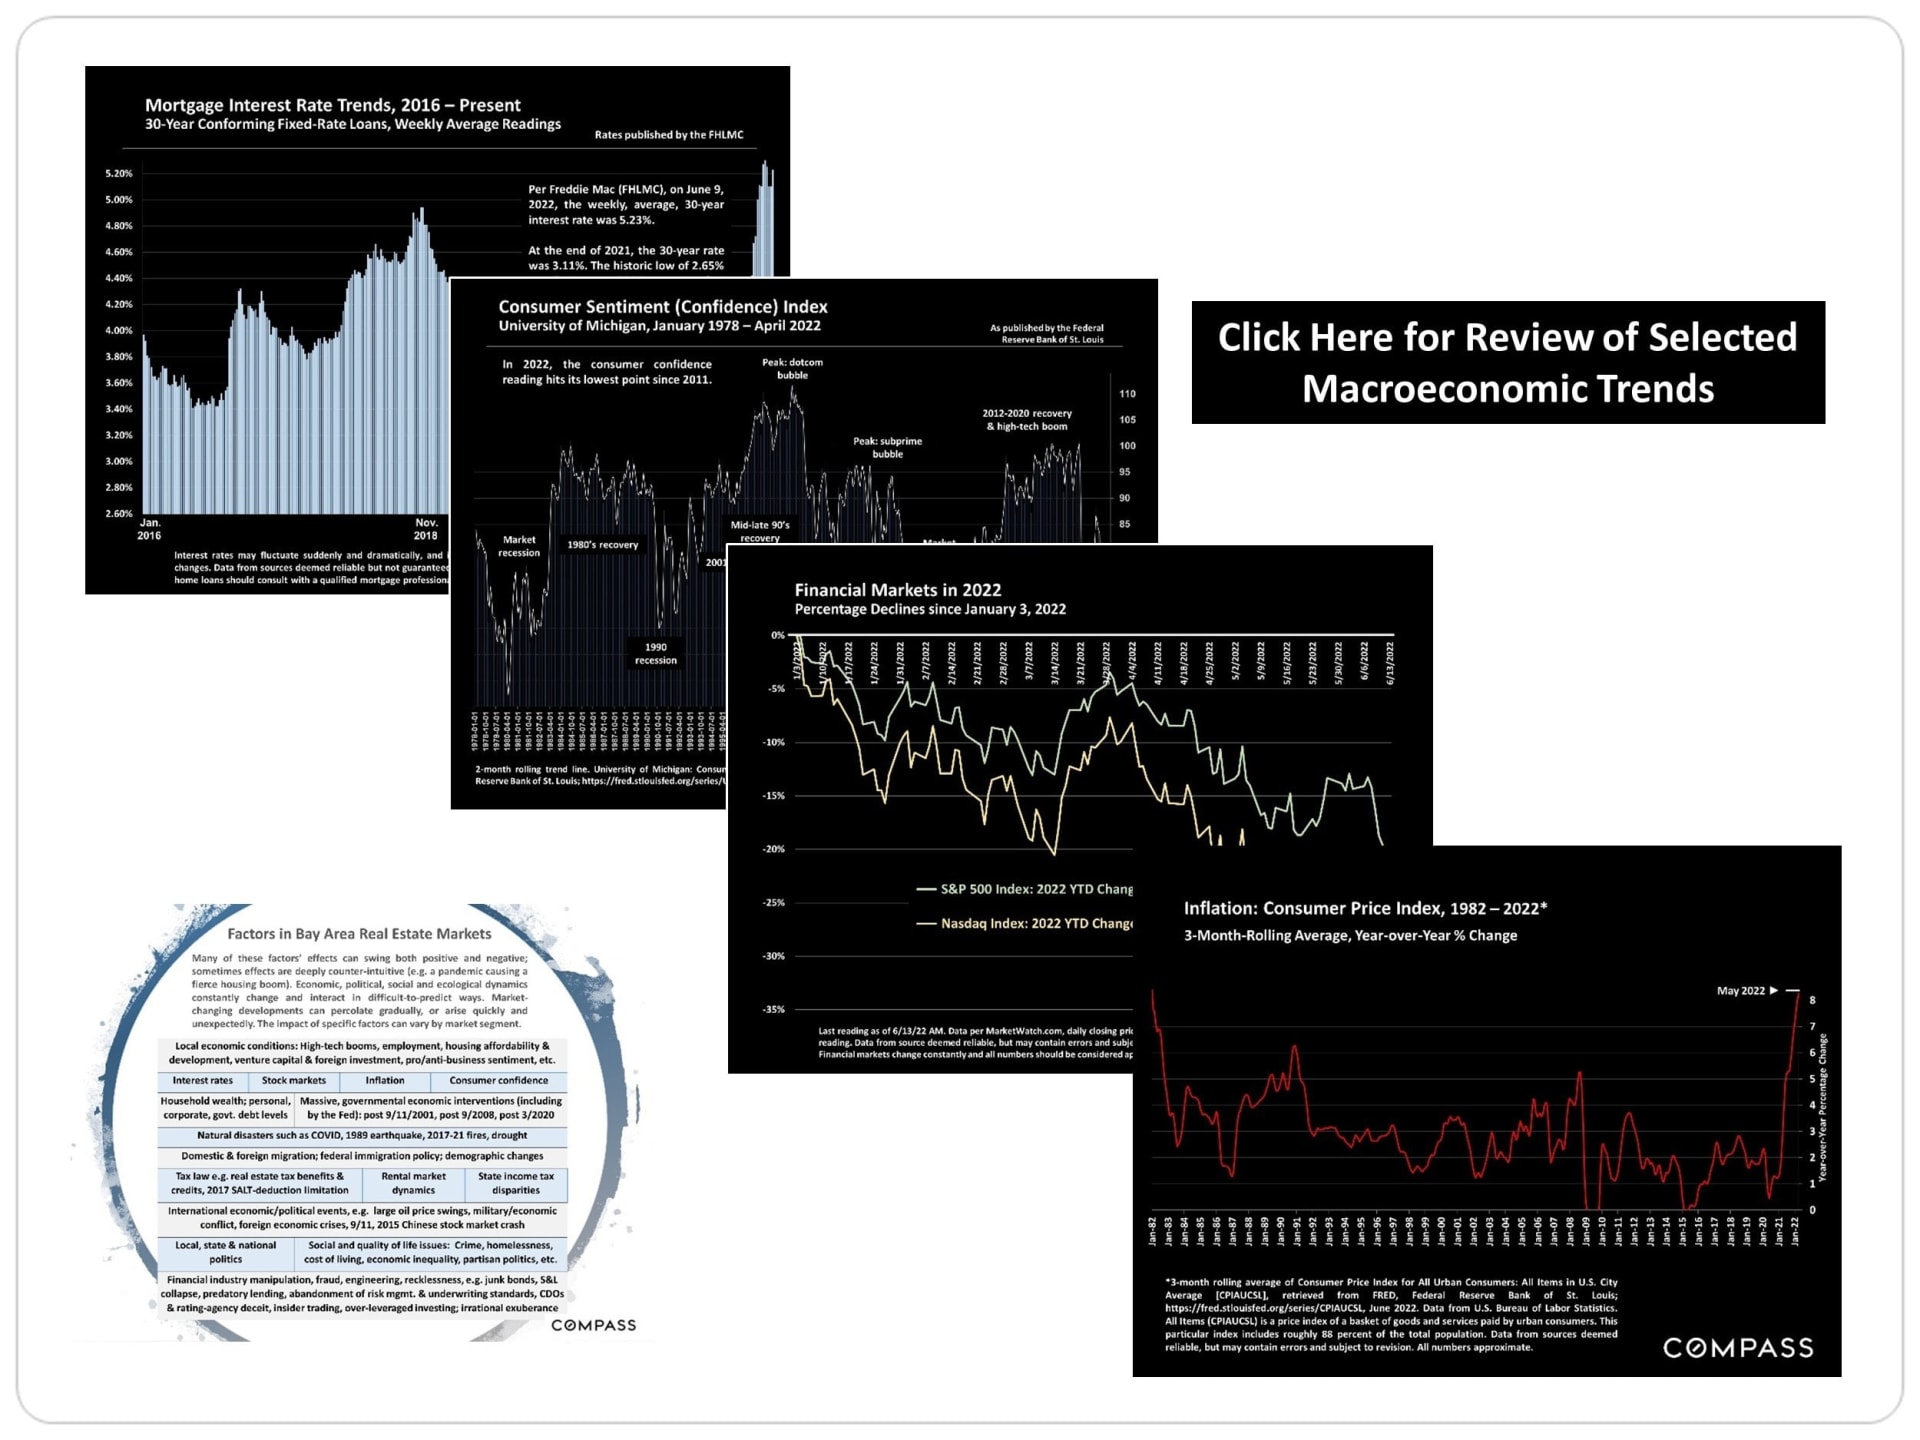
As you might expect, the principle reason we see fewer homes going into contract is due to the dramatic rise in mortgage rates, basically doubling to near 7%, compared to rates at around 3.5% in April.
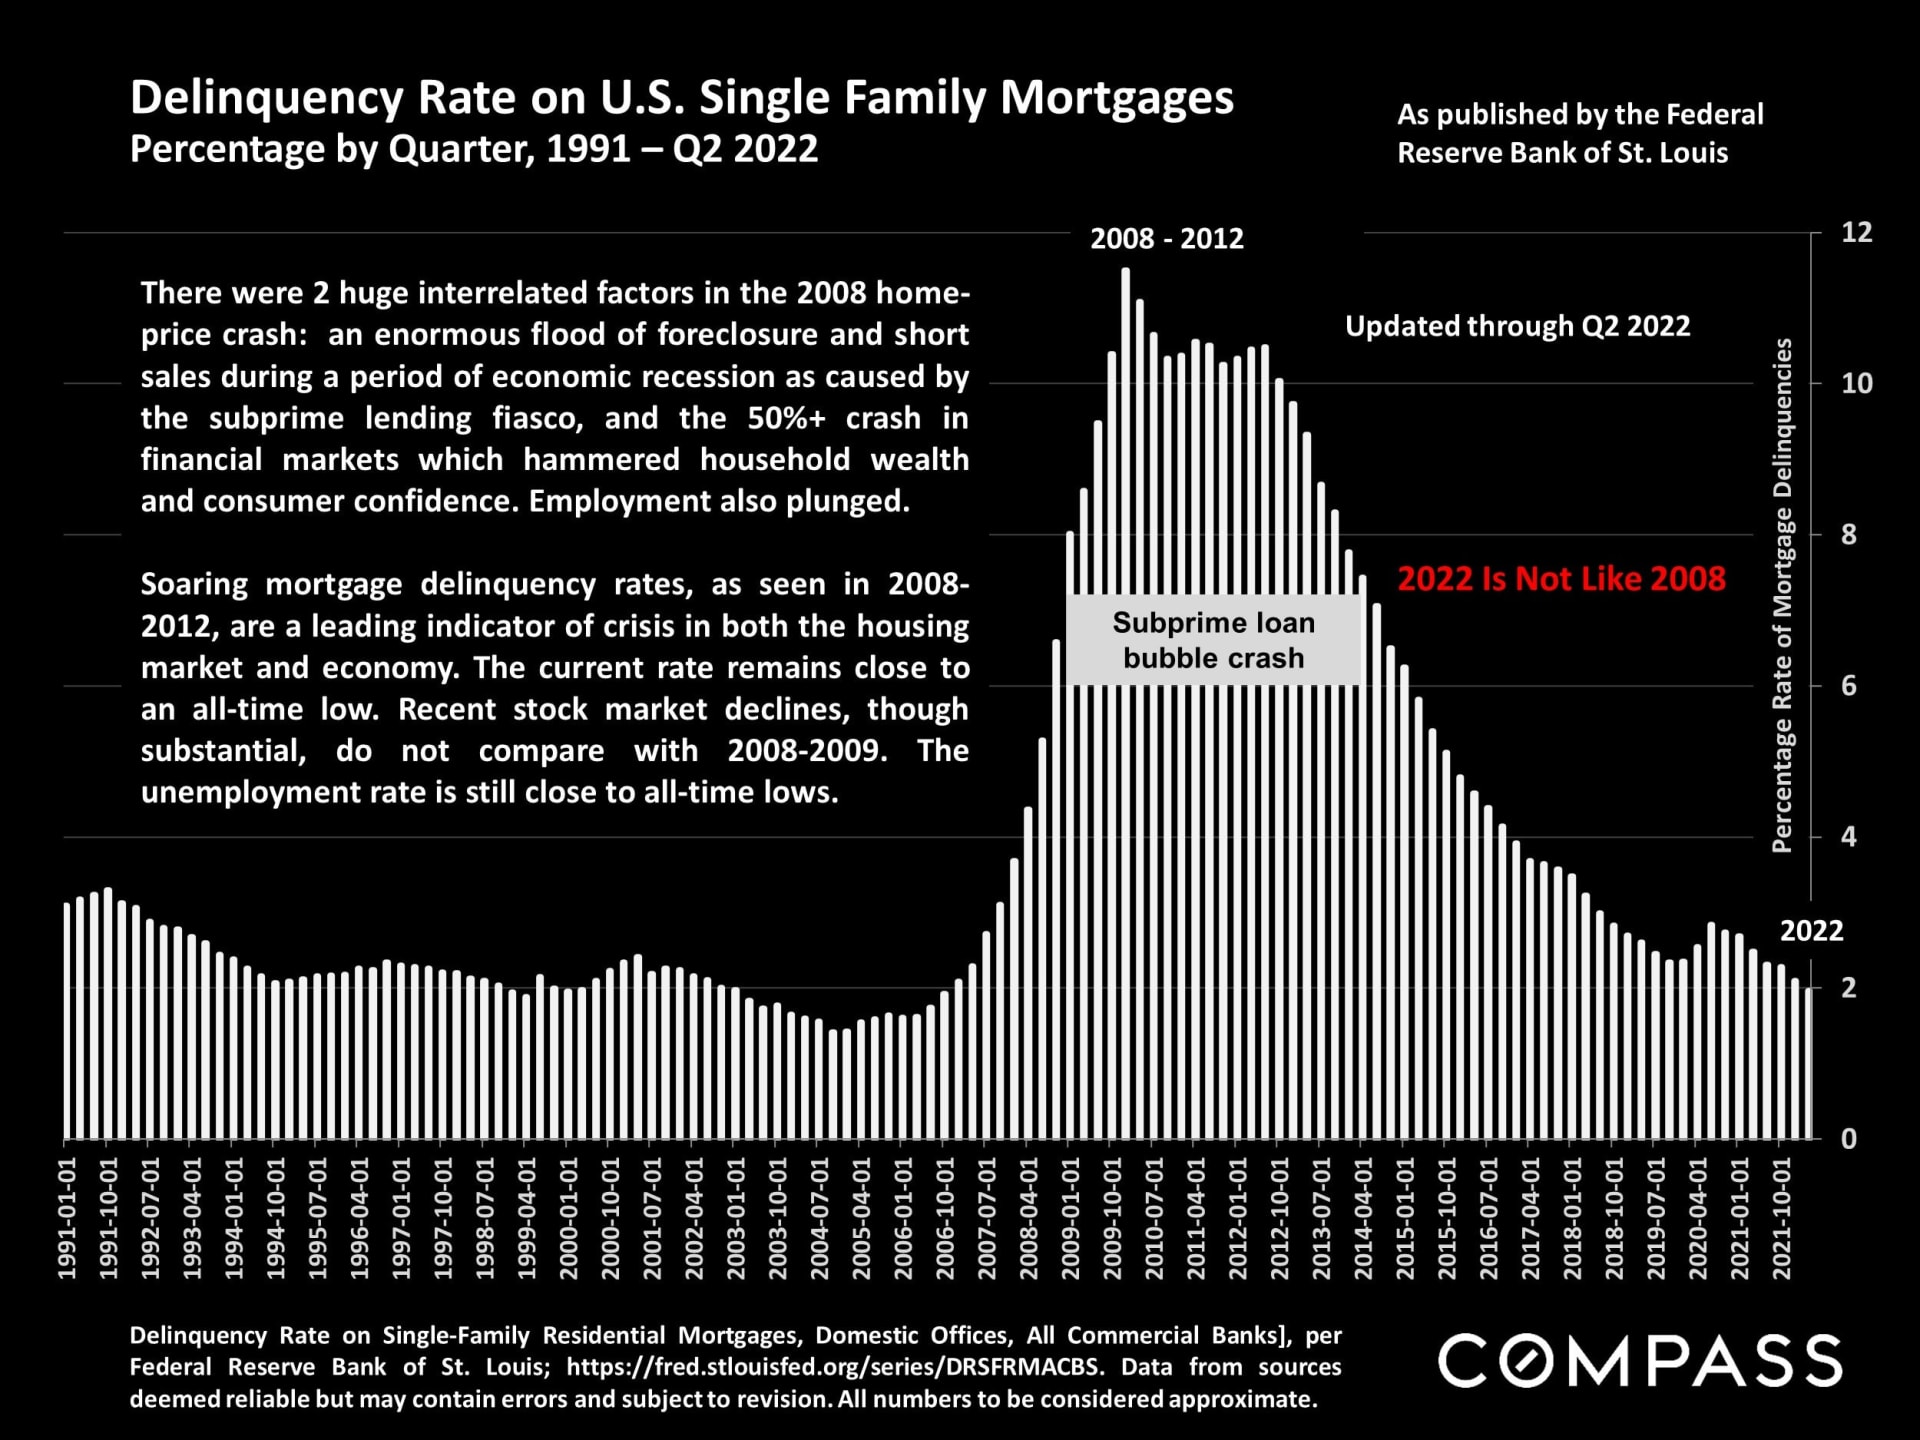
As we presented last month, while the cost of money is considerably higher than it was in April, rates are still low in the macro view since 1981. See the chart below. Mortgage delinquencies are at historic lows. See the chart...very different than 2008, when the downturn involved massive corruption in lending, investment banking and several sectors of the corporate world. This led to massive foreclosure and short sales, as well investment and retirement accounts suffering through scams and deep losses involving false narratives by banking and corporate leadership.
2022 is not 2008!
There are buyers out there! Many with cash...but they are more cautious. You have corporate and dual income salaries that still support buyers ability to purchase. (Remember last month's chart showing MEDIAN income at $184,000; highest in CA).
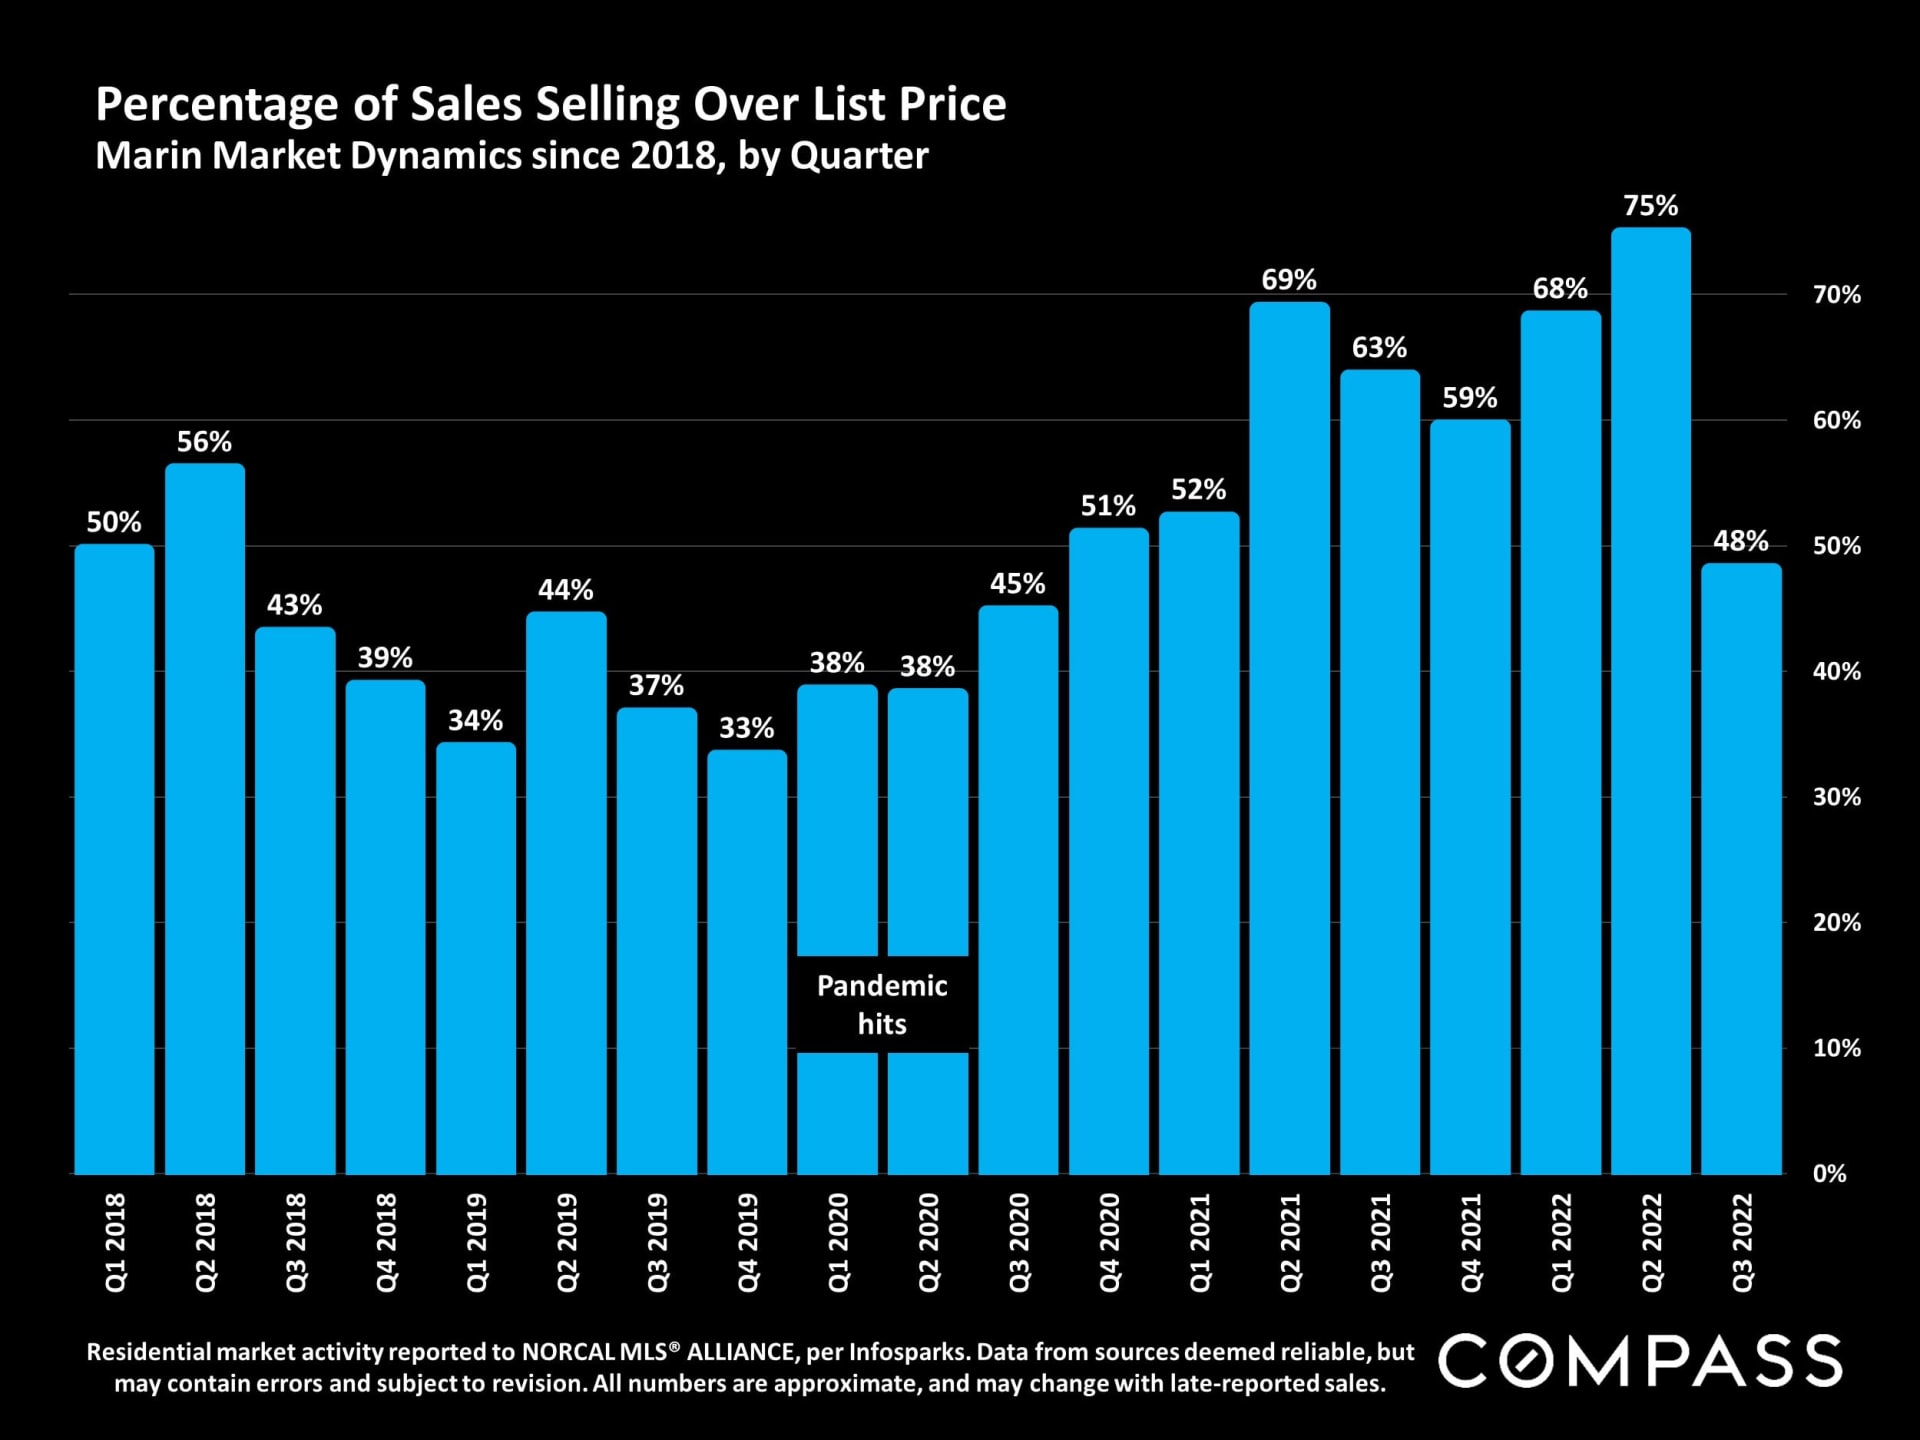
The market needs more homes to sell. What is proven many times over is if you prepare your home well, take care of needed repairs, and price according to recent sales in your neighborhood (still at January 2022 values), your home will sell quickly at an excellent price. Again, look at the long term values charts. The end result of Quarter 3 saw 48% of all sales in Marin selling above the list price.
Let's not forget to appreciate what is undeniable: We are able to walk in beauty and bounty daily through our good fortune to live in Marin. (and yes, pray for rain).
Yours sincerely,
Michelle and Ronda